Figure 1:

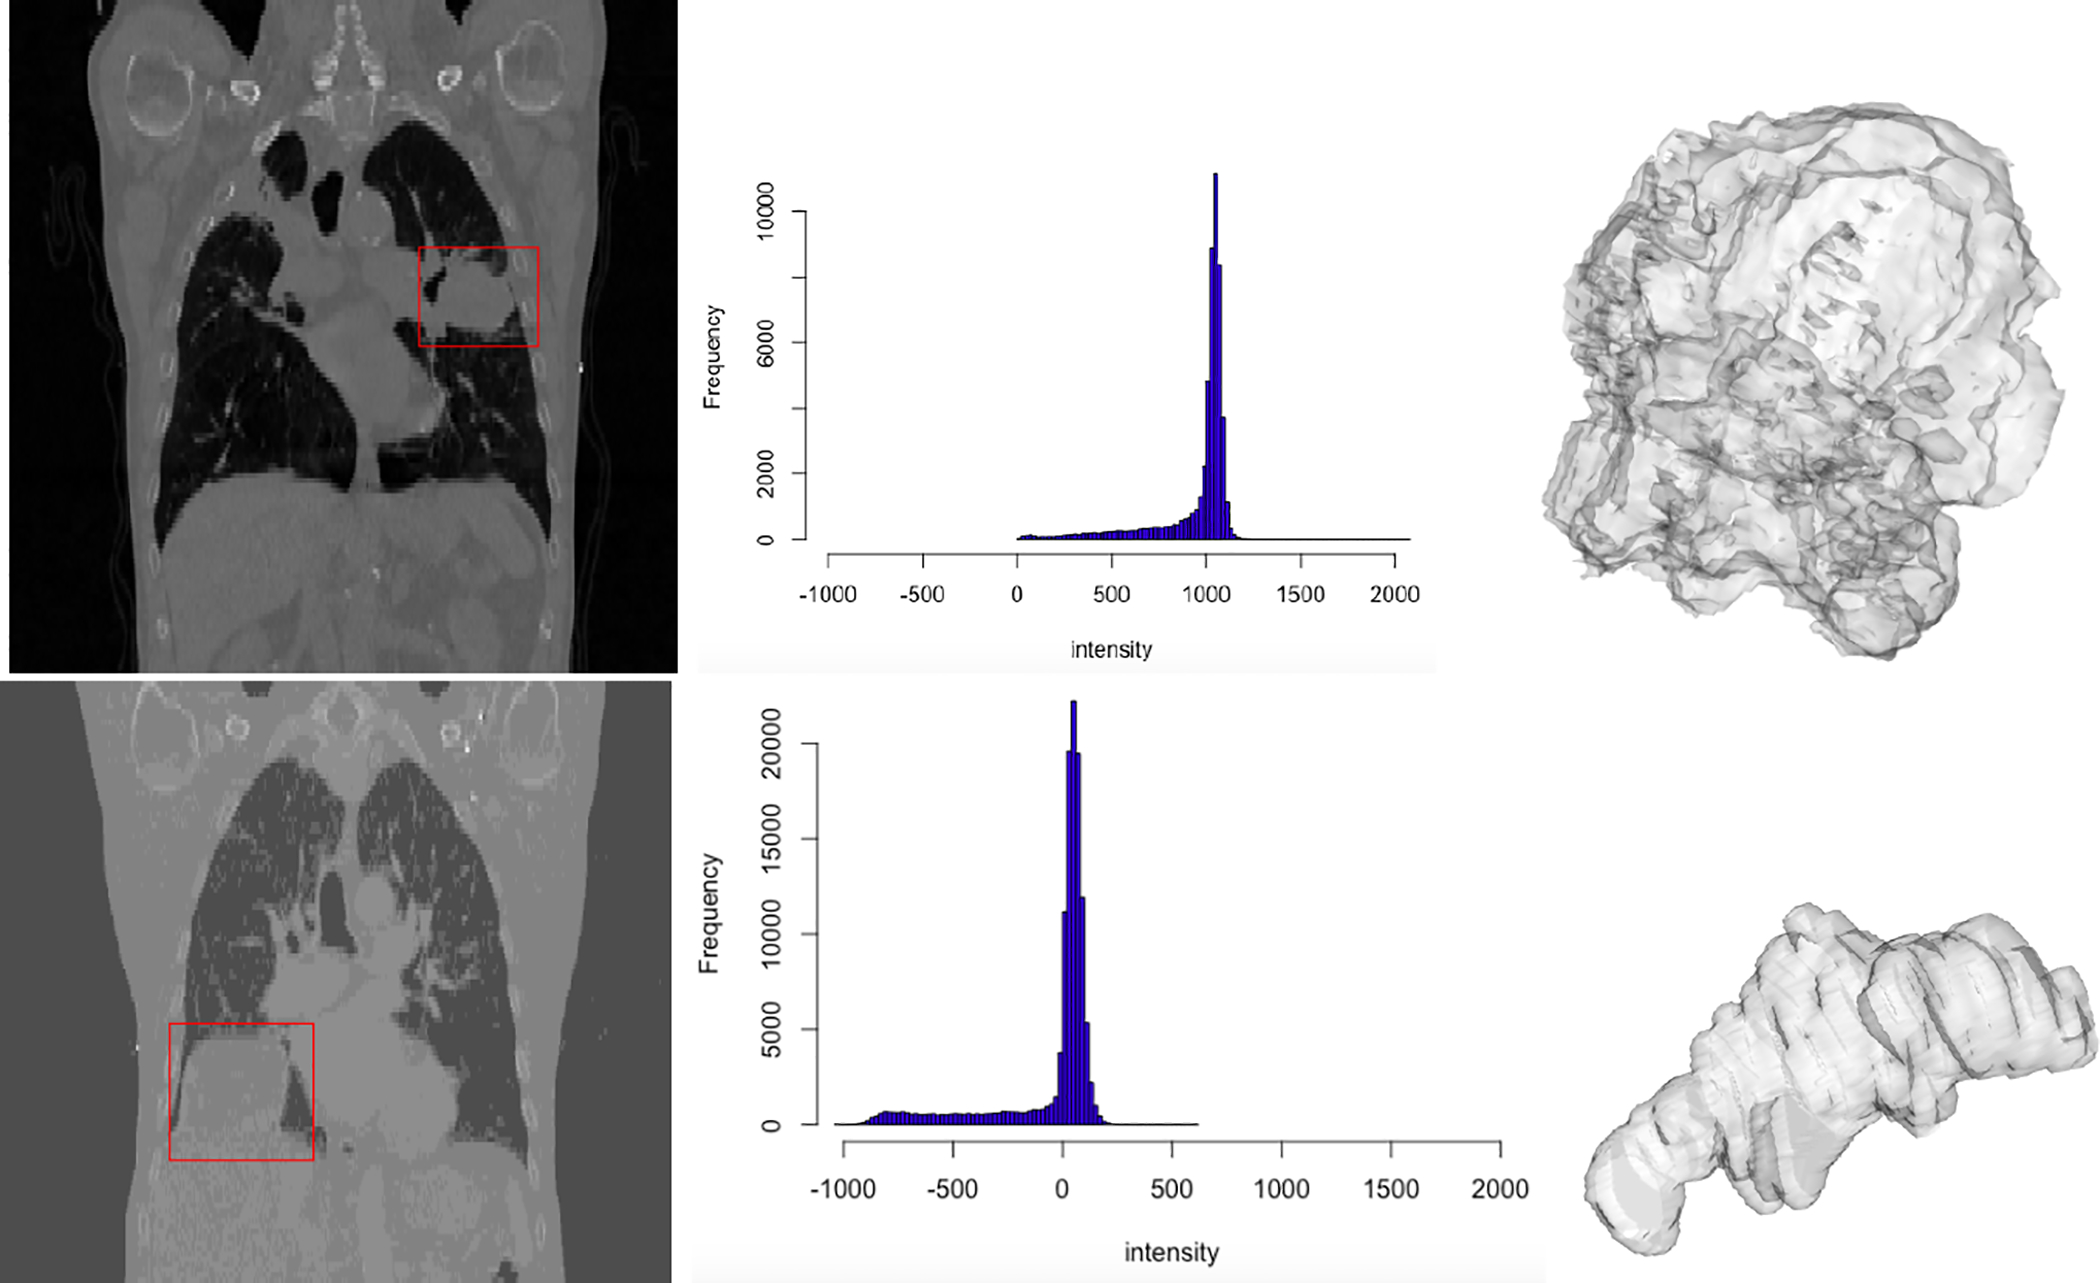
Left column: 2D slices of CT scans of two patients. The tumor is enclosed in a red box. Middle column: histograms showing the intensities of tumor voxels. Right column: 3D surface renditions of respective tumors.

Left column: 2D slices of CT scans of two patients. The tumor is enclosed in a red box. Middle column: histograms showing the intensities of tumor voxels. Right column: 3D surface renditions of respective tumors.