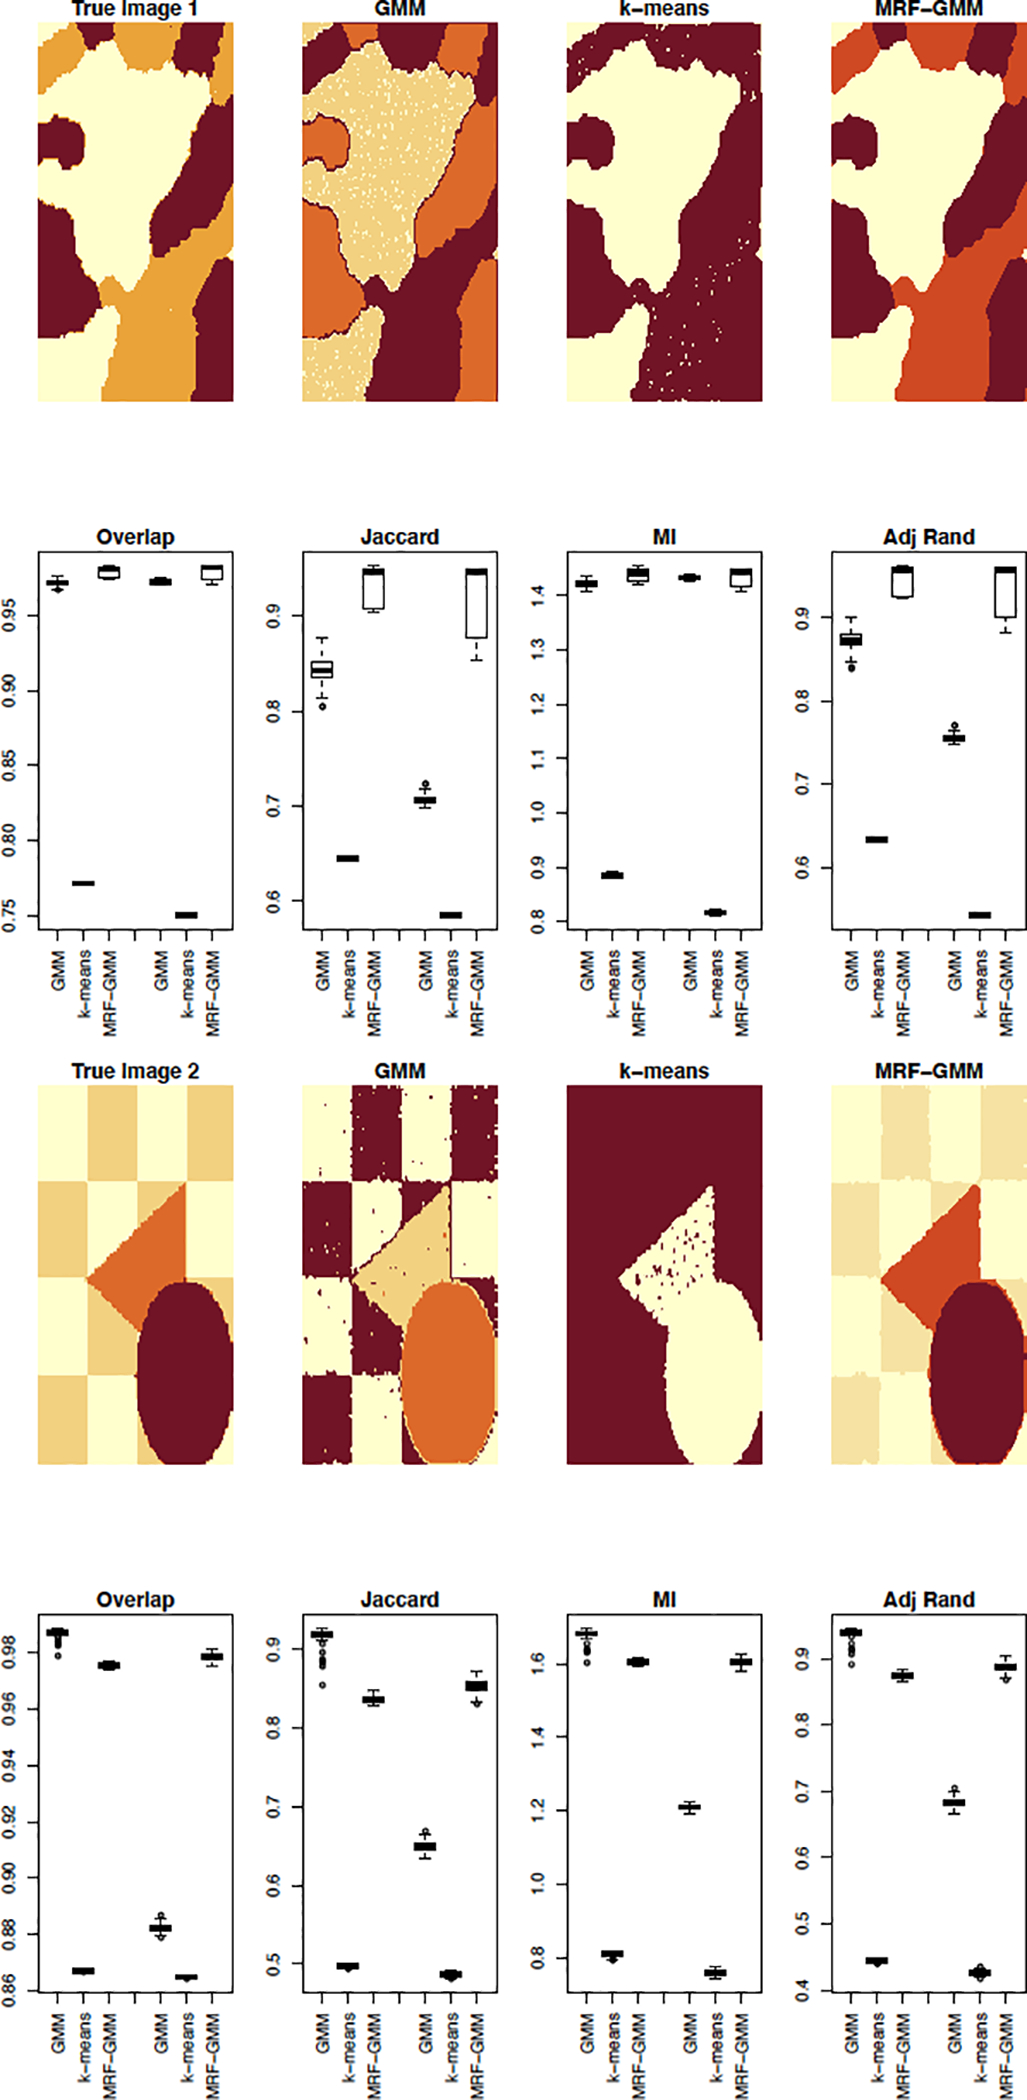
Figure 4:

Results of clustering the voxel intensities using k-means, GMM, and our proposed MRF-GMM. The true images as well as the estimated cluster segmentations by each of the three algorithms are shown on rows 1 and 3. Each of these rows are followed by a row of boxplots showing the results of the four cluster comparison measures (overlap, Jaccard index, mutual information (MI) and adjusted Rand index) for 100 runs of the simulations. Within each boxplot figure, the first three boxplots correspond to the first added noise setting (σ = 1 and σ = 2 for true images 1 and 2 correspondingly) while the second set of three boxplots corresponds to the second added noise setting (σ = 2 and σ = 3 for true images 1 and 2 correspondingly).
