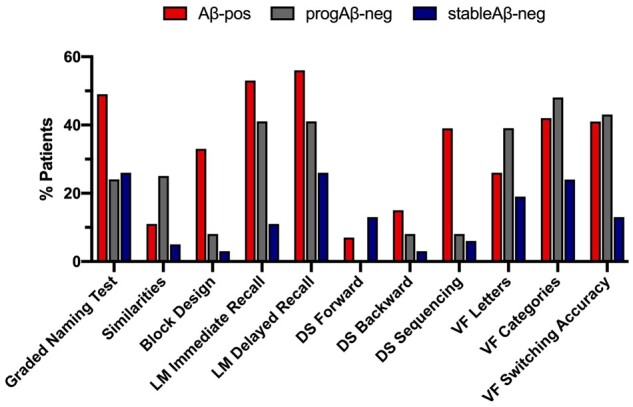
Figure 3.

Frequency of impairment across cognitive domains by group. Proportion of patients impaired (i.e., SS ≤ 4) in each cognitive measure across groups. LM = logical memory; DS = digit span; VF = verbal fluency.

Frequency of impairment across cognitive domains by group. Proportion of patients impaired (i.e., SS ≤ 4) in each cognitive measure across groups. LM = logical memory; DS = digit span; VF = verbal fluency.