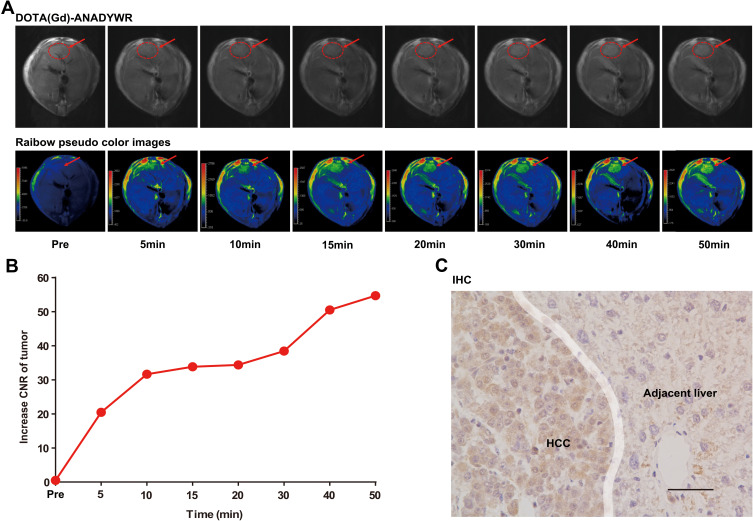
Figure 4.
MR imaging with DOTA(Gd)-ANADYWR in a c-Myc transgenic mouse. (A) Representative T1-weighted MR images and corresponding rainbow pseudo color images for a c-Myc transgenic mouse bearing an HCC lesion (The red arrowheads indicated the HCC. The red dotted circles delineated the area of interest that used for CNR analysis). (B) The increase CNR values of tumor before and at different time points after injection of DOTA(Gd)-ANADYWR. (C) Integrin α6 expression was analyzed using immunohistochemistry IHC in tumor tissue (Scale bar, 50μm).

