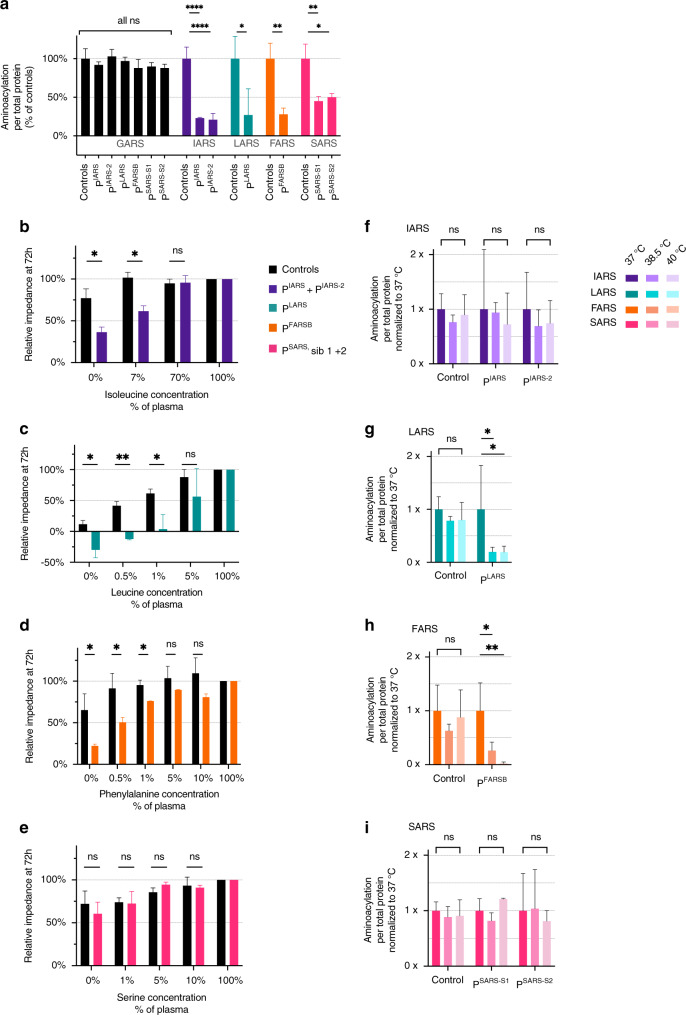
Fig. 1. Enzyme activity is decreased but not absent in all patients, and IARS, LARS, and FARSB patient fibroblasts are increased sensitive to isoleucine, leucine and phenylalanine deprivation, respectively.
(a) Enzyme activity is decreased but not absent in all patients. Aminoacylation activity in fibroblasts of PIARS, PIARS-2, PLARS, PFARSB, and two siblings with the same homozygous variant as PSARS, presented as percentage of age-matched controls. GARS activity was measured as an internal control. All measurements were performed in triplicate (n = 3), except IARS controls (n = 6) and GARS controls (n = 12). Error bars show standard deviation. Unpaired t-test: ns p ≥ 0.05, *p < 0.05, **p < 0.01, ***p < 0.001, ****p < 0.0001. (b–e) IARS, LARS, and FARSB patient fibroblasts are sensitive to isoleucine, leucine, and phenylalanine deprivation, respectively. Seventy-two hours proliferation of fibroblasts of PIARS, PIARS-2, PLARS, PFARSB, and two siblings with the same homozygous variant as PSARS, compared to age-matched control fibroblasts, exposed to decreasing concentrations of isoleucine (b: PIARS/PIARS-2), leucine (c: PLARS), phenylalanine (d: PFARSB), or serine (e: two siblings of PSARS), shown as normalized impedance, measured with an xCELLigence MP. Amino acid concentrations were compared to average plasma concentrations. Every donor was measured once (a; n = 1 each) or twice (b–d; n = 2 each). Two (a–c) or three (d) controls were measured once (n = 1 each). Error bars show standard deviation. Unpaired t-test: ns p ≥ 0.05, *p < 0.05, **p < 0.01, ***p < 0.001. (f–i) LARS and FARS activity deteriorate in LARS and FARSB patient fibroblasts, respectively. Aminoacylation activity in fibroblasts of PIARS and PIARS-2 (f), PLARS (g), PFARSB (h), and two siblings with the same homozygous variant as PSARS (i) at 37 °C, 38.5 °C, and 40 °C. Data are presented compared to the enzymatic activity at 37 °C. All measurements were performed in triplicate (n = 3). Error bars show standard deviation. Unpaired t-test: ns p ≥ 0.05, *p < 0.05, **p < 0.01.

