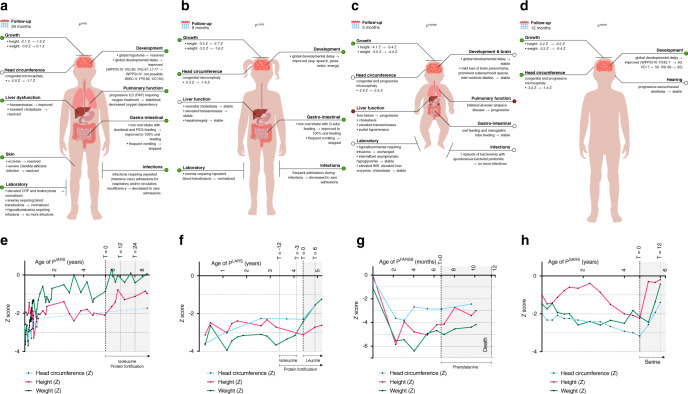
Fig. 2. Summary of symptoms with treatment effects, and growth charts for all patients.
(a–d) Summary of symptoms and treatment effects. Summary of the symptoms of PIARS (top left), PLARS (top right), PFARSB (bottom left), and PSARS (bottom right). Colors indicate the generalized treatment effect on the symptom (green: improved; white: stable or stabilized; red: progressed). Standard deviation scores (Z) for height, weight, and head circumference were calculated using Netherlands (NL) reference charts (PIARS; head circumference of PLARS), World Health Organization (WHO) reference charts (PFARSB), Centers for Disease Control and Prevention (CDC) reference charts (height and weight of PLARS), and French (FR) reference charts (PSARS). CRP C-reactive protein, FSIQ full-scale intelligence quotient, G-tube gastrostomy-tube, ILD interstitial lung disease, FRI fluid reasoning index, INR international normalized ratio, LI language index, PAP pulmonary alveolar proteinosis, PEG percutaneous endoscopic gastrostomy, PIQ performance intelligence quotient, VIQ verbal intelligence quotient, VCI verbal comprehension index, VSI visual–spatial index, WISC-V Wechsler Intelligence Scale for Children, fifth edition, WPPSI-III/IV Wechsler Preschool and Primary Scale of Intelligence, third/fourth edition. (e–h) Growth charts: Z-scores of height, weight and head circumference for age. Growth charts of height, weight, and head circumference in standard deviation score (Z) of (a) PIARS (NL reference charts); (b) PLARS (CDC reference charts for height and weight, NL reference charts for head circumference); (c) PFARSB (WHO reference charts); and (d) PSARS (FR reference charts). T in months from start of treatment.

