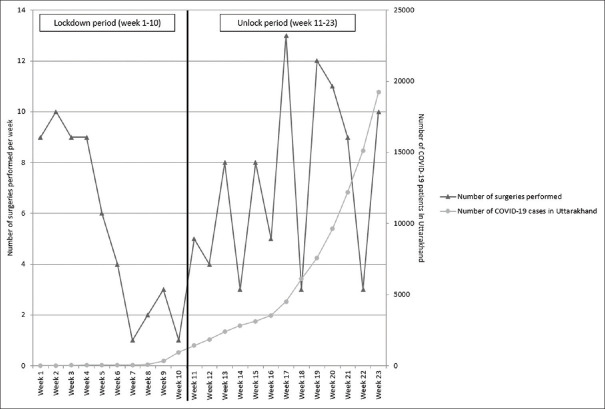
Figure 1.
Frequency polygon depicting the number of surgeries performed per week in relation to the rising trend of COVID-19 cases in Uttarakhand during the pandemic. During the lockdown period, there was a strongly negative correlation between the number of surgeries performed and the number of COVID-19 cases in the state and this result was statistically significant (rs (8) = −0.914, P = 0.000). While in the unlock phase, there was a weak correlation between the number of surgeries performed and the number of COVID-19 cases in the state. This result was not significant (rs (11) = 0.307, P = 0.307)

