
Figure 3.
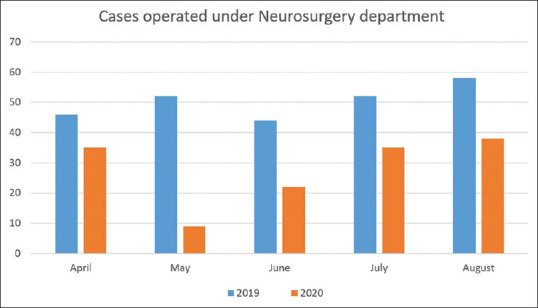
Vertical bar graph depicting number of surgeries performed from April to August in 2019 and 2020. During the ”lockdown” period of April and May, 44.9% surgeries were performed as compared to same months in 2019, whereas in the “unlock” period of June, July and August, this proportion increased to 63.6% compared to the same months in 2019 (P = 0.1889). However, when the same data for the 3 months of ”unlock” period was compared with month of May alone (17.3% surgeries in 2020 compared to last year), this difference was statistically significant (P = 0.0009)