
Figure 4.
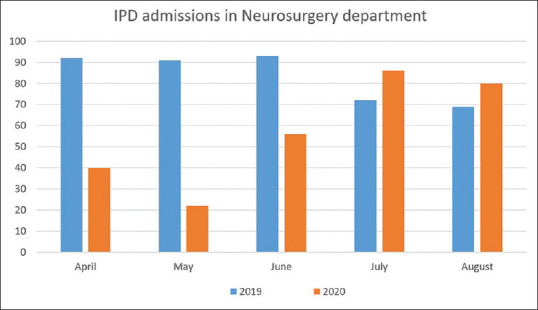
Vertical bar graph depicting the number of in-patient department admissions from April to August in 2019 and 2020. During the ”lockdown” period of April and May, there were only 33.9% hospital admissions as compared to same months in the previous year, whereas in the ”unlock” period of June, July and August, this proportion increased to 94.9% compared to the same months in the previous year. This change was found to be statistically significant (P < 0.00001)