
Figure 1.
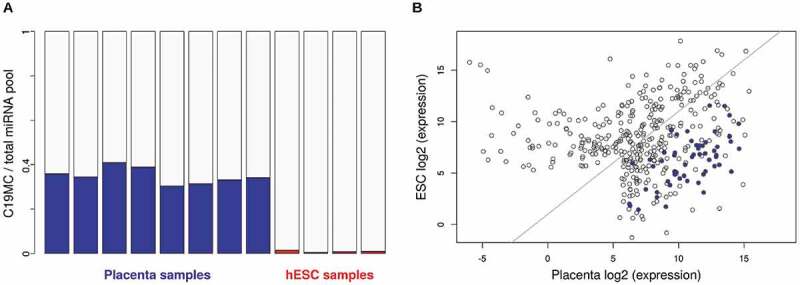
Investigation of mature C19MC miRNA expression. (A) Abundance of C19MC miRNAs in the total cellular miRNA population of placenta (n = 8; blue bars) and ESC (n = 4; red bars) samples (see Materials and Methods for dataset identifiers). (B) Expression levels of individual C19MC miRNAs. Averages of log2-transformed CPMs are shown in placenta (x-axis) and in ESC (y-axis). C19MC miRNAs are marked by blue dots