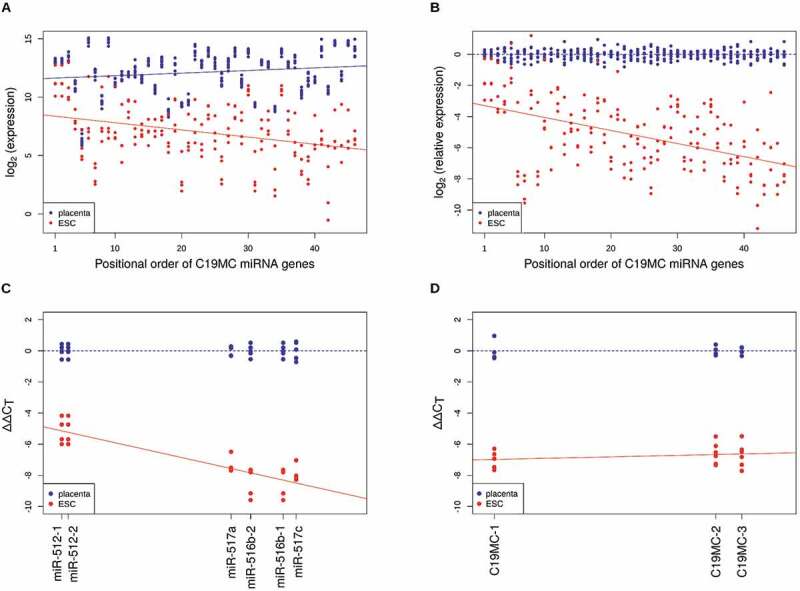
Figure 2.

C19MC miRNA levels are genomic position-dependent. MiRNAs encoded by the same pre-miRNA (5p and 3p arms) were summed and ordered by their genomic position from first to 46th (x-axis). Y-axis shows log2-transformed (A) CPMs and (B) CPMs normalized to average placenta levels for each sample (placenta (n = 8; blue dots); ESC (n = 4; red dots)). Blue and red lines illustrate fitted linear models for placenta and ESC samples, respectively. For panel (B), the β-coefficient of regression is −0.08401, with p value of 3.5e-12. (C) Small RNA-seq results were reproduced by qRT-PCR on selected miRNA targets (β-coefficient: −0.08134, p value: 2.53e-06; blue dots are placenta samples (n = 5), red dots are ESC samples (n = 4)). (D) Pri-miRNA expression levels were measured by qRT-PCR and were found to be position-independent (β-coefficient: 0.00928, p value: 0.321). Primers for detecting the indicated PCR amplicons are listed in Suppl. Table 1
