
Figure 4.
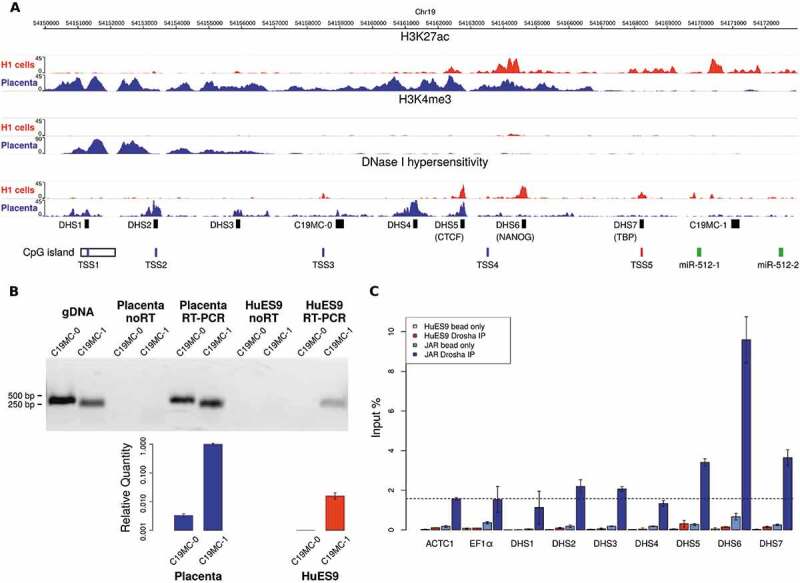
Promoter usage analysis in placenta tissues and in embryonic stem cells (H1 cell line as example) by investigating the epigenetic marks on a 22 kb DNA segment upstream of C19MC. (A) H3K4me3 modifications indicate two putative tissue-specific promoters with distinct active enhancer regions (H3K27ac modifications and DNase hypersensitive regions). The upper promoter is active in placenta, with four identified transcription start sites (TSS1-4 by CAGE-Seq data [26], shown in blue); while a more downstream alternative promoter initiates transcription in ESC (TSS5, shown in red). The TSS1 is located in a longer CpG island shown to be methylated in non-placental tissues [11]. PCR primer targets are marked by black boxes: the seven putative enhancers (DNase I hypersensitive sites, DHS1-7) and the two pri-miRNA transcripts (C19MC-0 for the longer, and C19MC-1 for the shorter form). The first two miRNAs of the cluster (hsa-miR-512-1 and −2) are marked by green boxes (B) The pri-miRNA with a longer 5ʹ end (C19MC-0) was detected only in the placenta sample (RT-PCR end point detection, gel image on upper panel). JAR genomic DNA (gDNA) was used for primer testing; the ‘noRT’ samples serve as negative controls. For the placenta and the HuES9 samples, C19MC-0 and C19MC-1 transcripts were also quantified by real-time PCR, using PolR2A as endogenous control; error bars show S.E.M. values. (C) ChIP-qPCR results analysing Drosha binding to the DHS sites and two unrelated promoter regions (ACTC1 and EF1α), the latter two being used for background control (indicated with a dashed line). Significant enrichment for DHS5-7 regions were detected in JAR cells (blue bars), but only weak binding in HuES9 cells (red bars, see separately also in Suppl. Fig. 6). Beads without antibody were used as ChIP negative controls (light blue and light red bars for JAR and HuES9, respectively), error bars indicate standard deviations