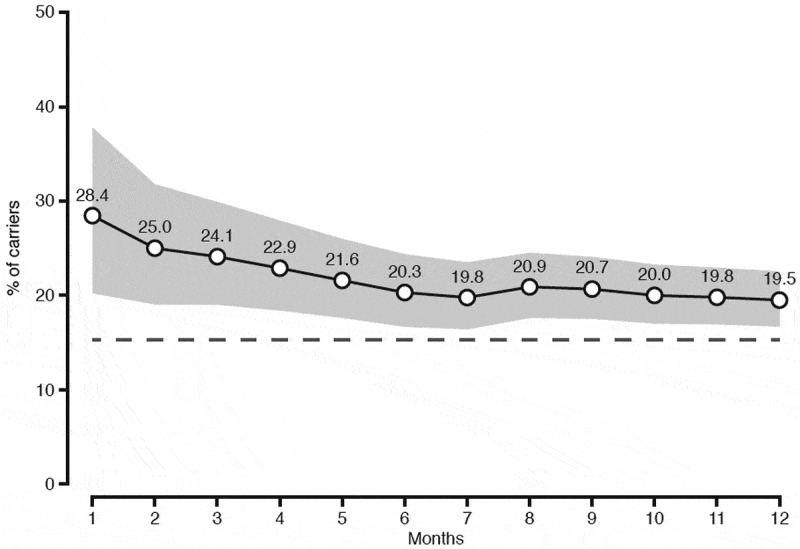
Figure 2.

Cumulative change in the proportion of Kp carriers among those who had used antibiotics 1–12 months before the fecal sampling. Shaded gray area represents the 95% CI. The time period at each specified month includes data for the preceding months. The dashed black line indicates the prevalence of carriage in the non-antibiotic using population (15.2%)
