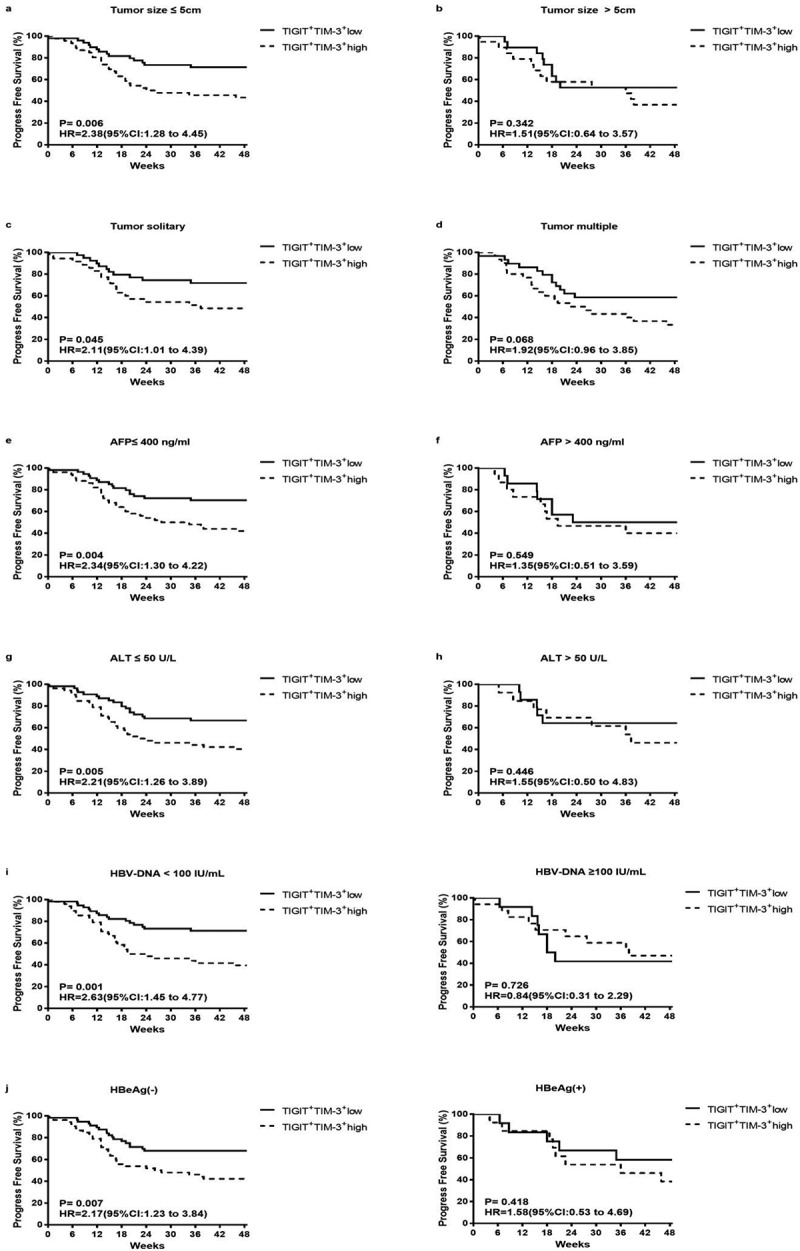
Figure4.

Kaplan–Meier curve analysis showing the efficacy of TIGIT+TIM-3+NK cells levels as a predictor of progression-free survival in HBV-HCC across different tumor load, liver function level and HBV virus load. a-b Patients with different tumor size, tumor size ≤ 5 cm (a), tumor size > 5 cm (b); c-d patients with different tumor number, tumor solitary (c), tumor multiple (d); e-f patients with different AFP level, AFP ≤ 400 ng/ml (e), AFP > 400 ng/ml (f); g-h patients with different ALT level, ALT≤ 50 U/L (g), ALT > 50 U/L (h); i patients with different HBV-DNA level; j patients with or without HBeAg. P values and HRs were obtained using the log-rank test
