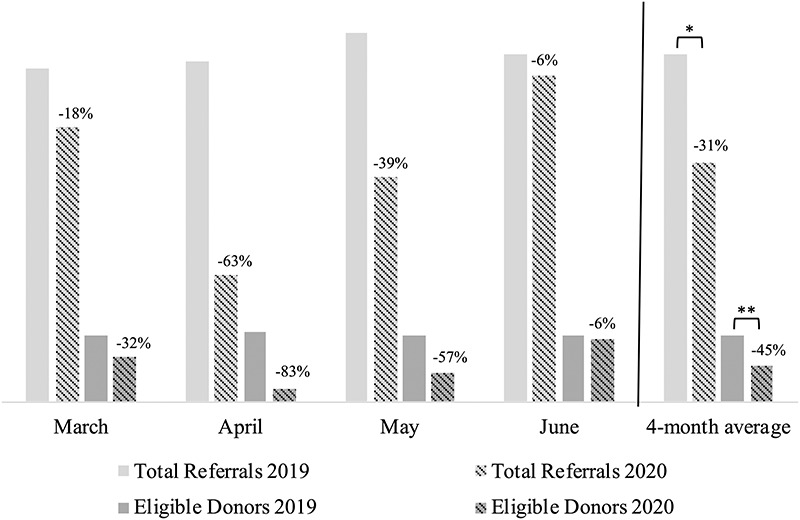
FIGURE 1.

Total referrals to and resulting eligible donors from the eye bank with percent changes from 2019 to 2020. Total referrals: donors for which the eye bank was called for potential tissue procurement; eligible donors: procured donors who were eligible for surgical transplantation. *Total referrals P = 0.044 and **eligible donors P = 0.031.
