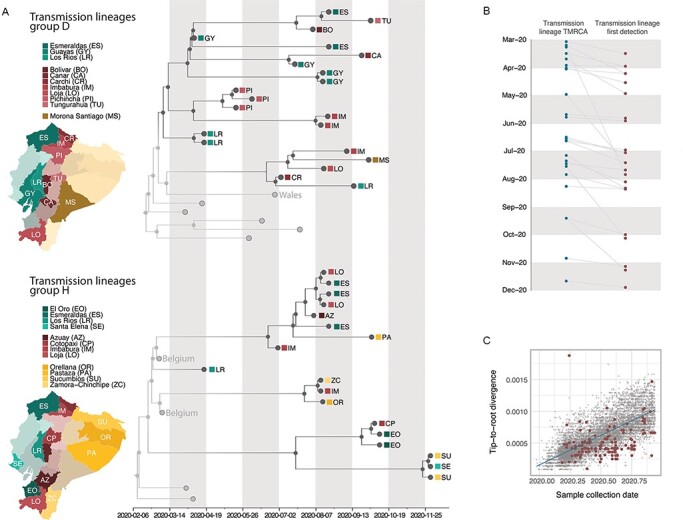
Figure 2.

Time calibrated phylogenetic trees for the major transmission lineages in Ecuador. (A) Subtrees extracted from a time-calibrated Maximum Clade Credibility (MCC) tree of SARS-CoV-2 whole genome sequences, corresponding to the two largest clusters of sequences from Ecuador. Tree tips are coloured by sampling location (in Ecuador, red, versus outside of Ecuador, grey); nodes and branches are coloured by inferred location through a two-state DTA analysis. The province where each sequence was sampled is annotated on the tips, and maps highlight these provinces. Tips that correspond to sequences that cluster together within the major Ecuadorian clusters are also annotated with the region where the samples were collected. (B). Detection lag of individual transmission lineages in Ecuador, showing the median TMRCA of each transmission lineage from our data set (blue) connected by a grey line to the date of the earliest sequence in that transmission lineage (red). (C) Root-to-tip genetic distances (based on a heuristically rooted maximum likelihood tree) versus sample collection dates for the SARS-CoV-2 data set used in this analysis. Data points corresponding to sequences collected in Ecuador are highlighted in red, and the linear regression trendline is shown in blue.
