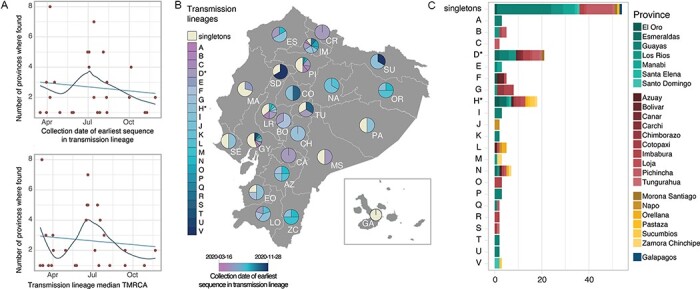
Figure 3.

SARS-CoV-2 transmission lineages in Ecuador. (A) Summary of the geographic spread of transmission lineages in Ecuador, showing the number of provinces where each transmission lineage is found compared to the collection date of the earliest sequence in each transmission lineage (upper panel) or the inferred median TMRCA for each transmission lineage (lower panel). The trend lines show a linear regression in light blue and a fitted local polynomial regression in dark blue. (B) Contribution of individual transmission lineages and singleton sequences in each province. Transmission lineages (shades of blue) are ordered based on the earliest sample collection date in the group from earliest (darker) to more recent (lighter). (C) Bar plot summarising the provinces where each transmission lineage was sampled over the study sampling period.
