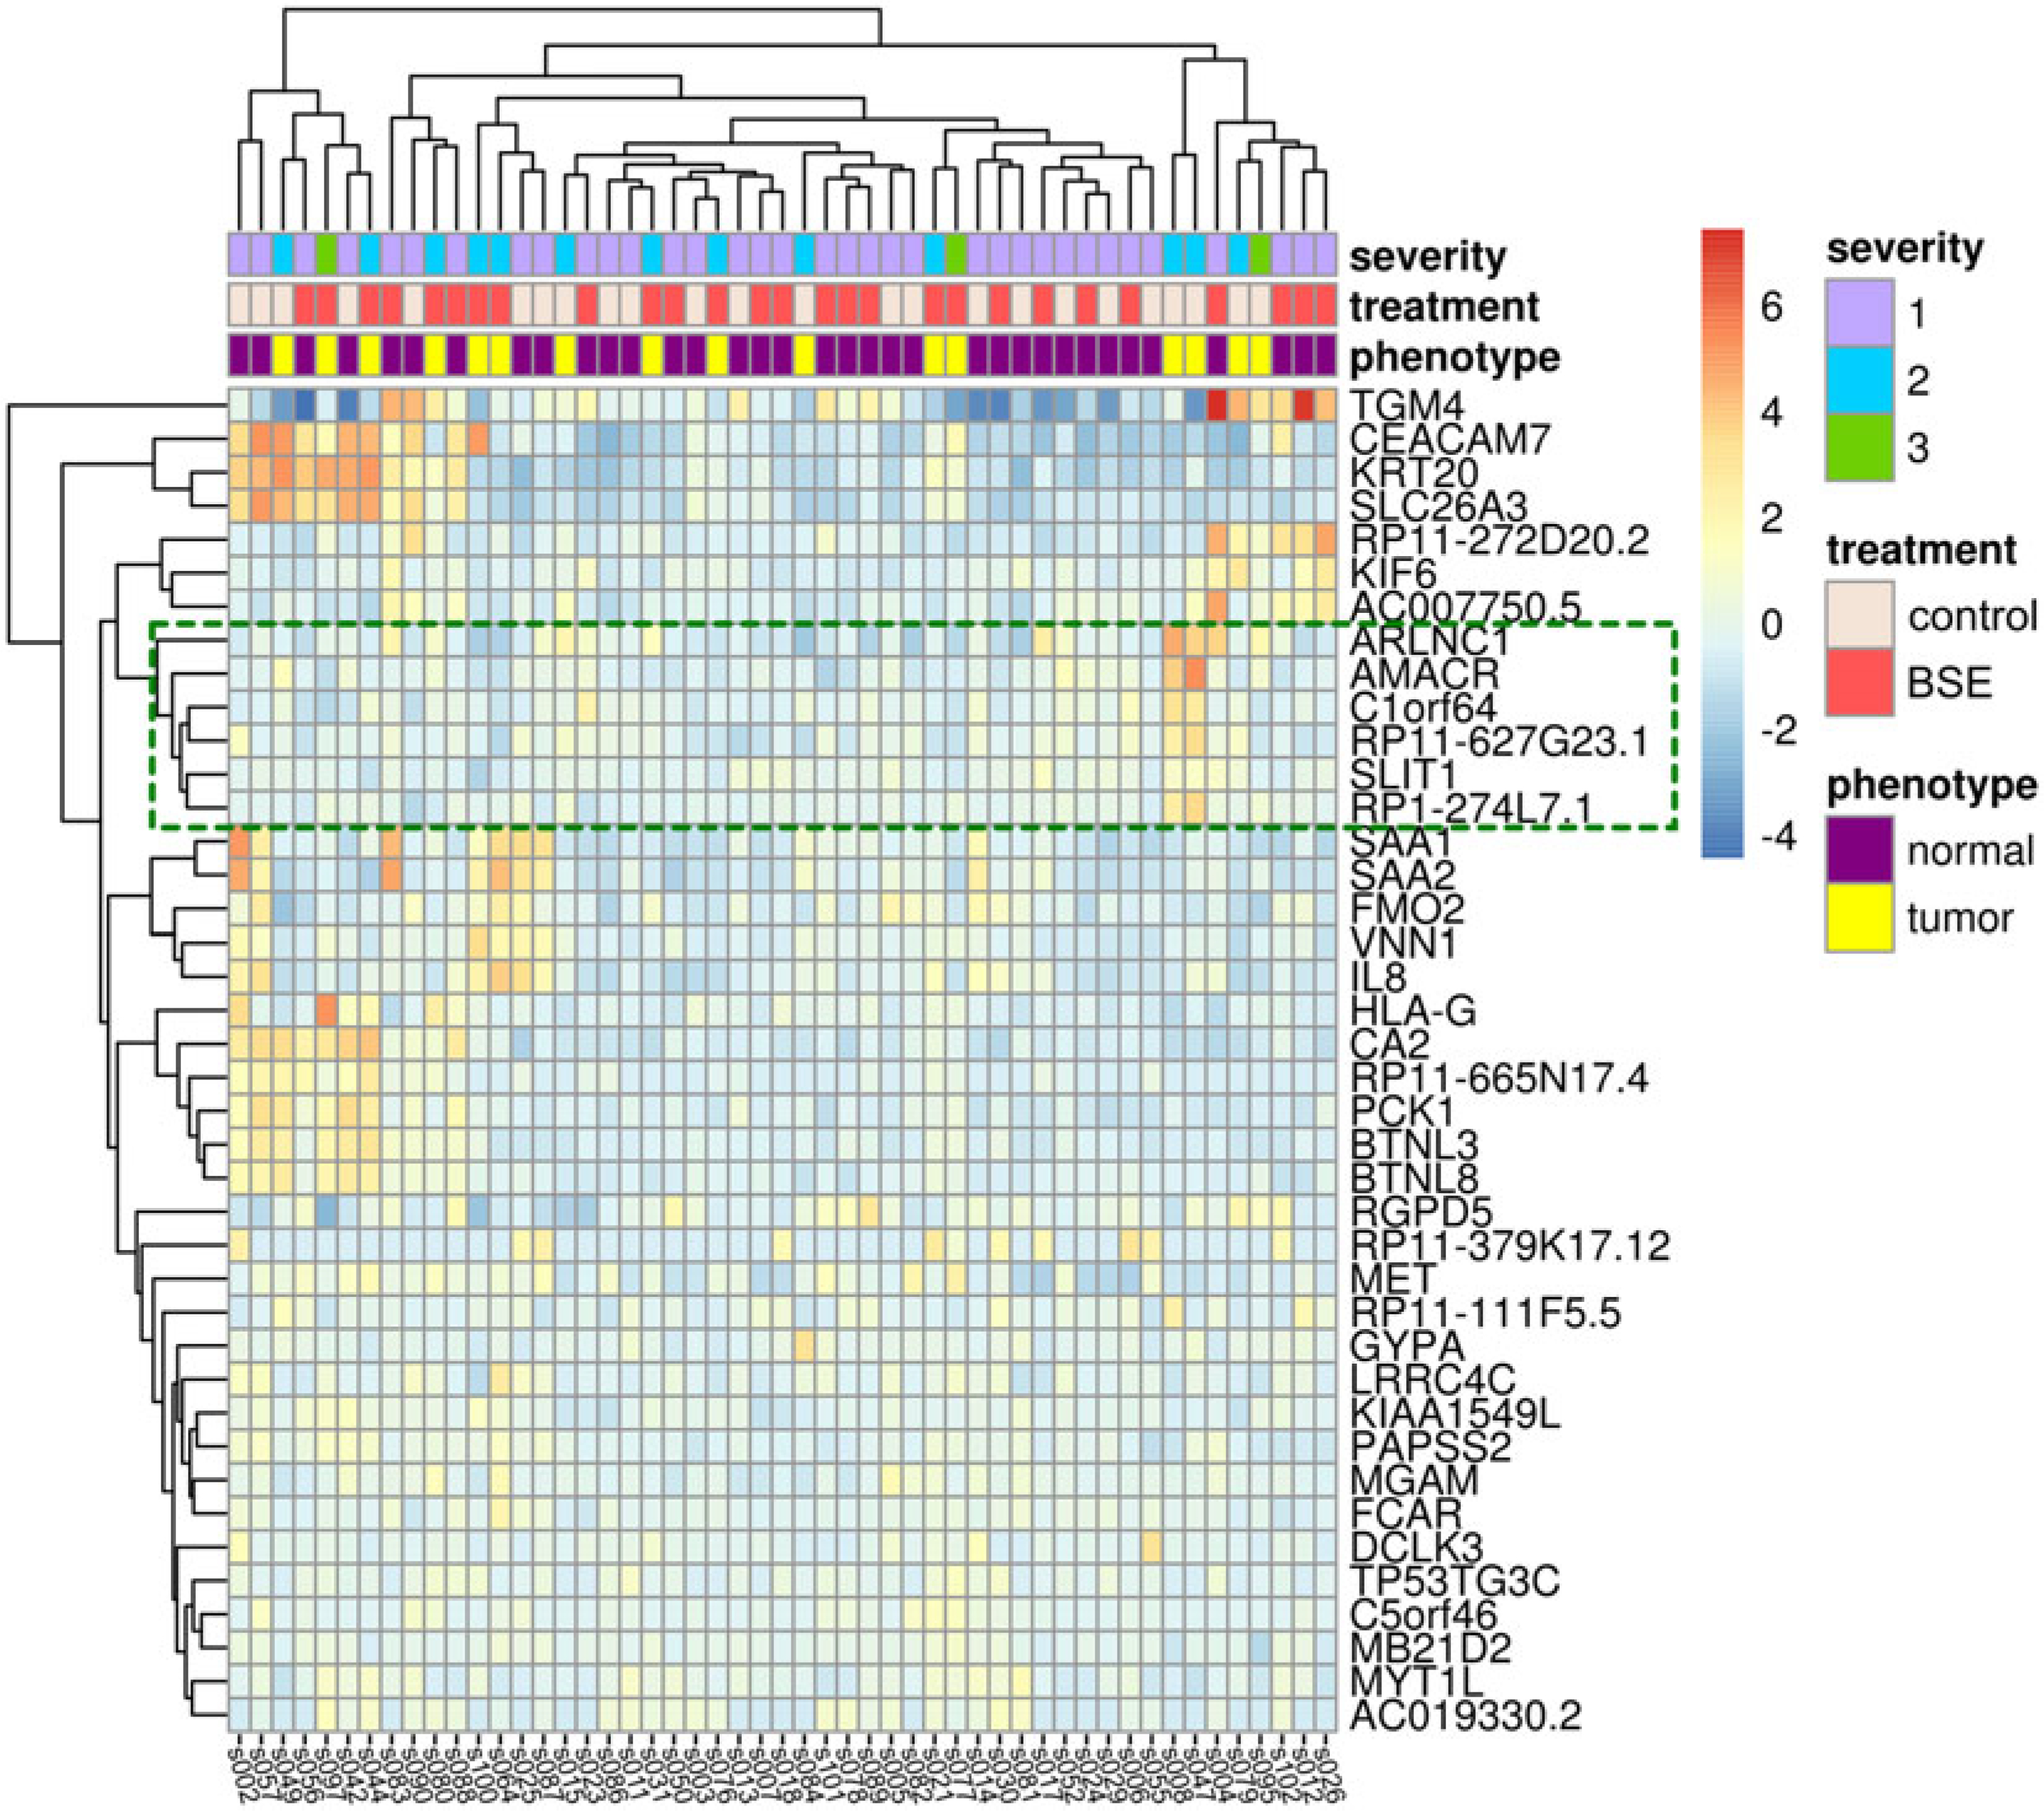
Figure 2. Expression patterns of significantly differentially expressed genes.

The heatmap shows the 40 significantly differentially expressed genes with respect to the BSE treatment on samples that came from subjects with evidence of prostate cancer. Columns represent expression of each sample, with sample labels at the bottom of the heatmap. Rows represent each differentially expressed gene, with the HUGO Gene Nomenclature Committee (HGNC) gene names listed along the right of the heatmap. Individual cells are colored relative to the row means of log2-fold changes. Each sample is annotated with level of cancer severity in the subject, treatment, and phenotype along the top of the heatmap. Dendrograms along the top and left side of the heatmap represent hierarchical clusters determined based on Euclidean distance calculations of sample-wide and gene-wide expression dissimilarities, respectively. The green box shows the cluster of six genes we identified, with two, AMACR and ARLNC1, having expression confirmed using qPCR (Figure 3).
