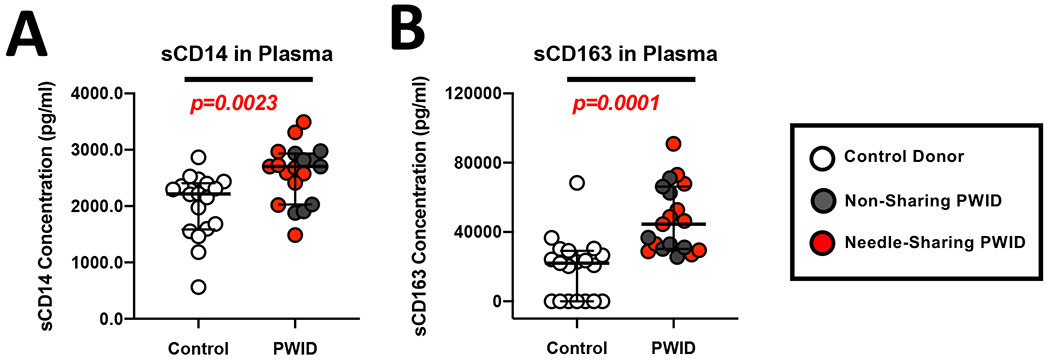
Figure 1. Increased levels of sCD14 and sCD163 in the plasma of PWID compared to controls.

(A-B) Composite graph displaying the levels of sCD14 (A) and sCD163 (B) in the plasma from non-sharing (light gray circles) and needle-sharing (dark gray circles) PWID compared to control donors (white circles).
