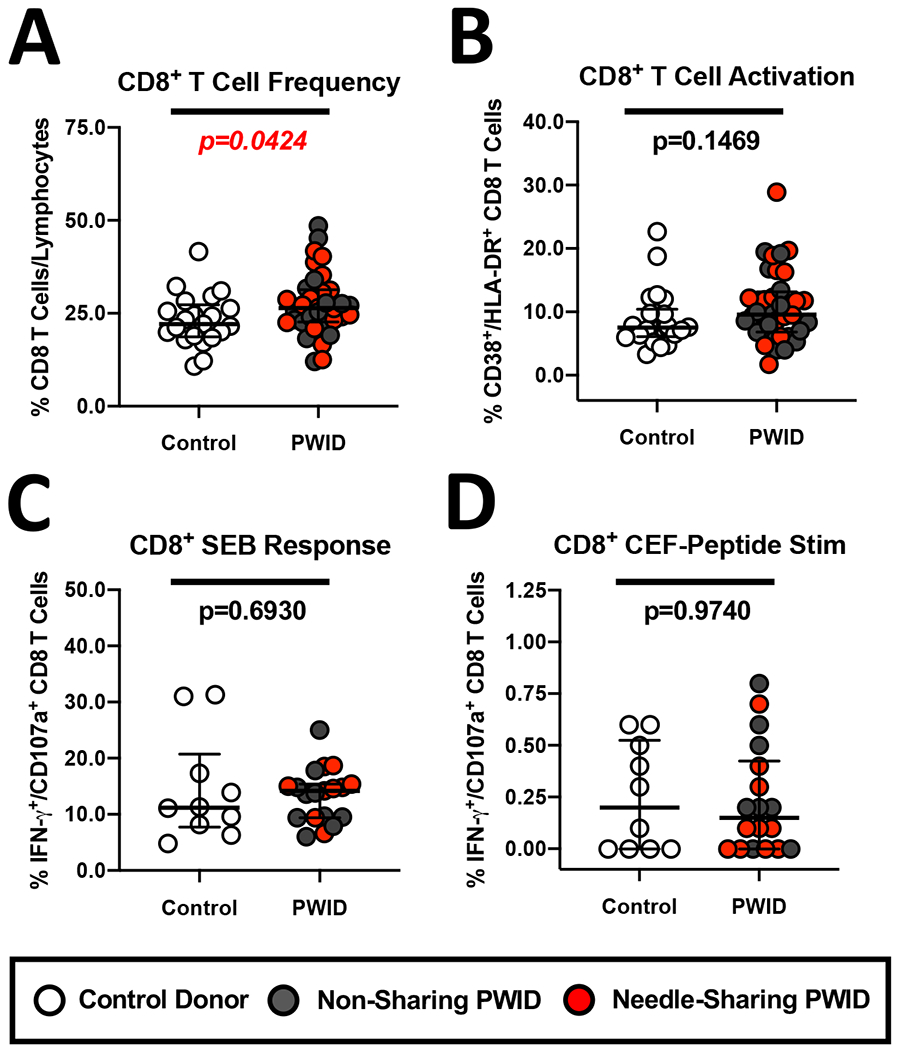
Figure 5. Similar levels of CD8 T cell activation and antigenic peptide response in PWID and control donors.

(A-B) Composite graph displaying the increased (A) frequency of CD8+/CD3+ T cells and (B) similar constitutive CD38+/HLA-DR+ activation of CD8 T cells from non-sharing (light gray circles) and needle-sharing (dark gray circles) PWID compared to control uninfected donors (white circles). (C-D) Functional analysis of the CD8 T cell response in PWID compared to control donors in response to (C) SEB or (D) a mixture of overlapping CEF peptide pool consisting of sequences derived from the human Cytomegalovirus, Epstein-Barr and Influenza Viruses (CEF) for 18 hours. Unstimulated or stimulated PBMC were stained with fluorescently conjugated antibodies to CD8 phenotypic markers and permeabilized to measure intra-cellular cytokine expression. The percentage of CD8+/CD3+ cells staining positive for CD107a and/or IFN-gamma was determined after subtraction of background levels of staining in unstimulated control cells. Statistical analyses of two groups was performed using a non-parametric Mann-Whitney T-test with a two-tailed p-value.
