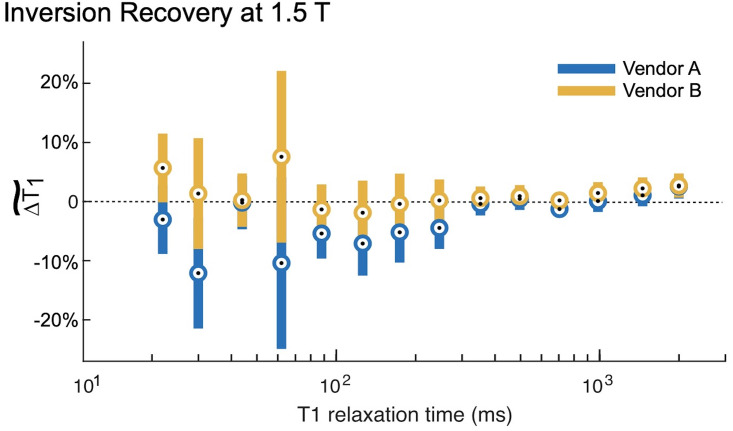
Fig 2. Inversion recovery measurements at 1.5 T.
The inversion recovery (IR) measurements at 1.5 T both over- and underestimated the T1,NMR. The circles represent the within group means, and the error bars are 95% confidence intervals about these means. The IR measurements, especially in the range of physiological T1 values (~250 ms for adipose tissue to 1800 ms for grey matter) are biased approximately 5% high. Both vendors exhibited this bias; there are no significant differences between them throughout the entire range of T1 times spanned by the ISMRM/NIST phantom array (Table 4).

