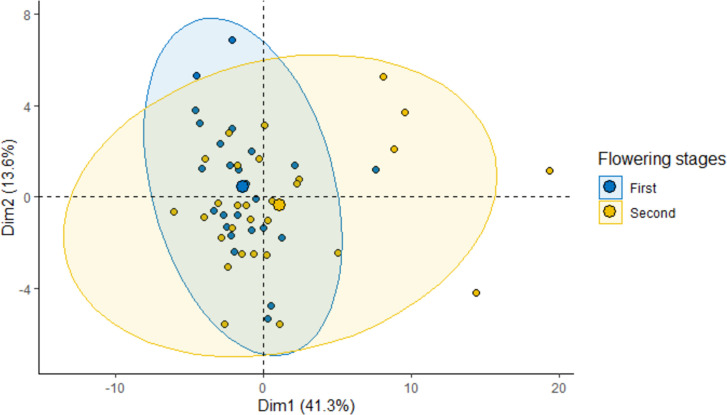
Fig 5. 2D PCA-plot of protein profile in function of marri flowering season.
Biplot of the first and second axes obtained from the principal component analysis (95% confidence ellipses are shown) showing dependencies of protein profile between first and second marri flowering stage. Points represent venom samples (n = 55).

