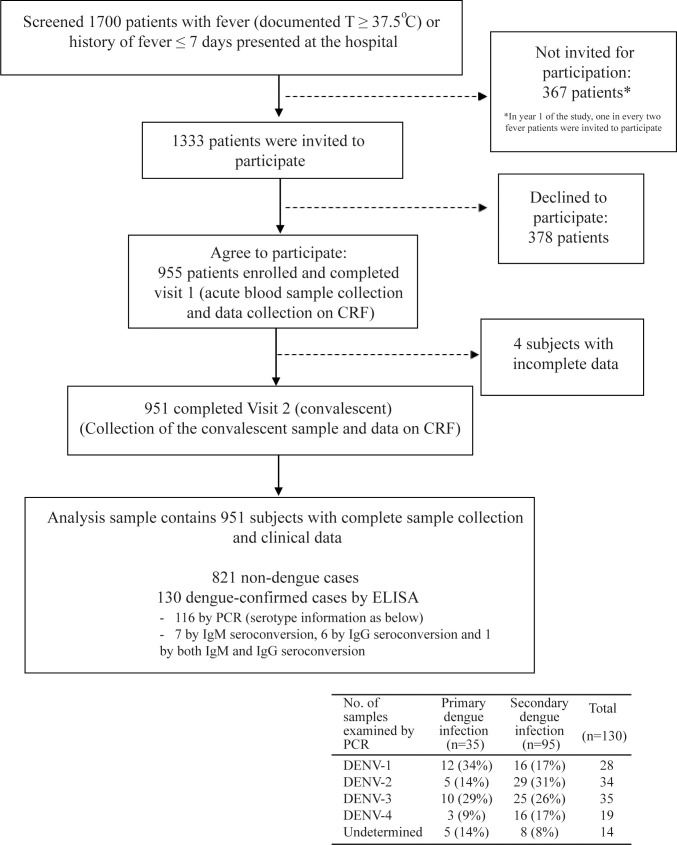
Fig 3. A chart of patient flow in the passive fever surveillance at the study facility.
The chart describes patient flow in the passive fever surveillance from screening, enrollment to study participation, with determination of laboratory-based status of dengue infection, as well as how the analysis sample was reached.

