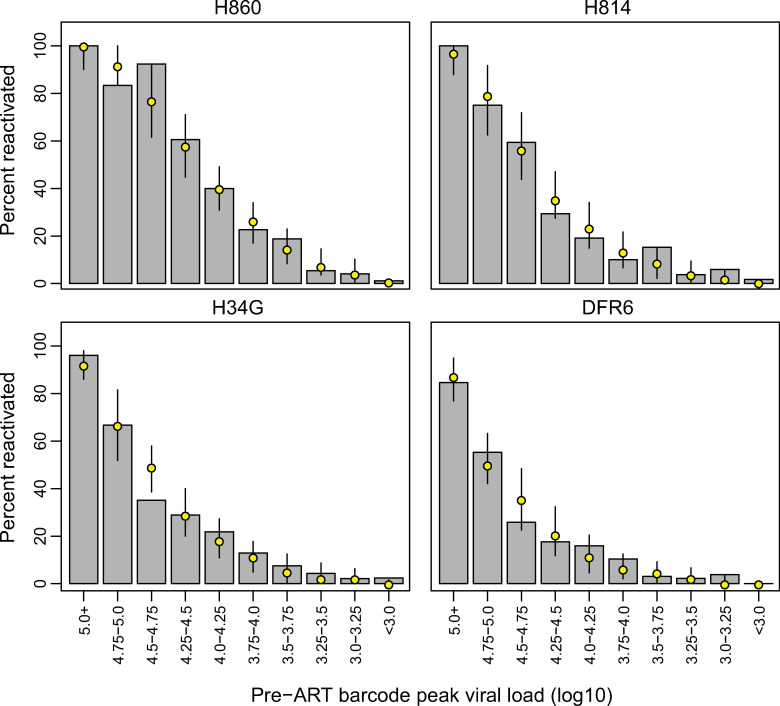
Fig 4. Size of viral lineage pre-ART predicts reactivation after treatment discontinuation.
Barcodes were partitioned into 0.25-log10 intervals based on their pre-ART plasma viral loads. The grey bars depict the proportion of barcodes from each viral load category that were observed at peak rebound viremia during ATI-2. The yellow points correspond to the median simulated number of reactivated barcodes in each category, with 90% credibility intervals.

