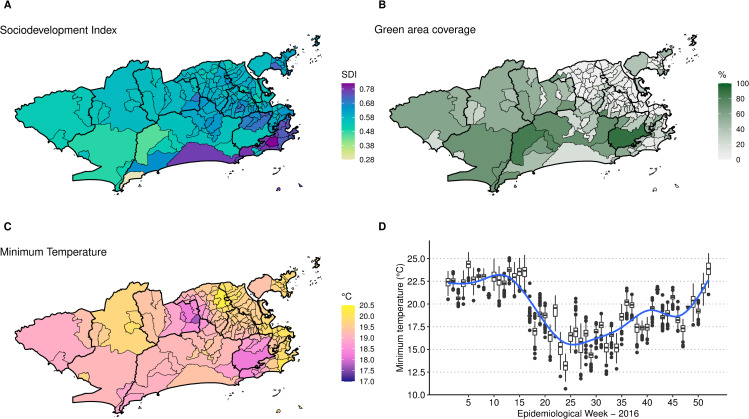
Fig 4.
Sociodevelopment index in 2010 (A), percentage of green areas in 2015 (B), minimum temperature (°C) average in 2016 by neighbourhood (C) and boxplot of the minimum temperature (°C) by neighbourhood and week (D), Rio de Janeiro city, Brazil. Maps created using R version 3.6.1. Map layers by Instituto Pereira Passos (https://www.data.rio/).

