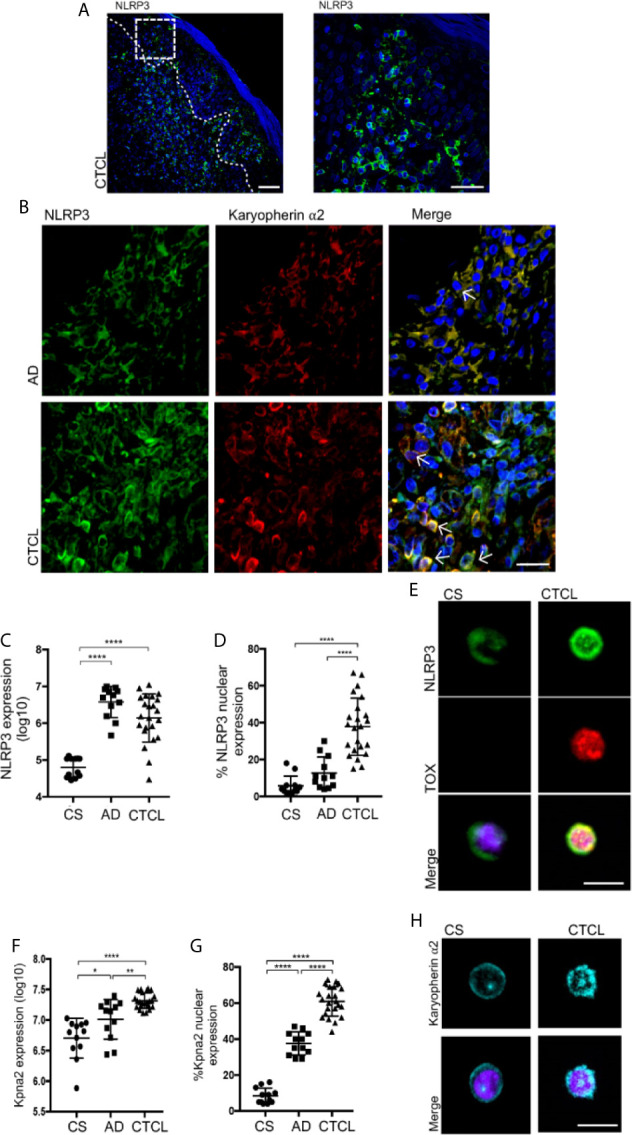
Figure 2.

NLRP3 and karyopherin α2 display nuclear and perinuclear localization in CTCL plaques. (A) Representative microphotograph showing NLRP3 expression in the Pautrier microabscesses area. (B) Representative immunofluorescence (IF) and z-stack reconstructions of NLRP3 (AF-488) and karyopherin α2 (AF-594) expression in CTCL plaques and AD ( Supplementary Videos 1 and 2 , respectively). Quantification of the total expression of (C) NLRP3 and (D) percentage of cells with NLRP3 nuclear expression in the microphotographs of CTCL plaques (n = 23), AD (n = 12), and CS (n = 12). (E) Representative IF of NLRP3 (AF-488) and TOX (AF-594) in CD4+ T cells isolated from CTCL plaques and CS (n = 5). Quantification of the (F) total expression of karyopherin α2 and (G) percentage of karyopherin α2+ cells in the microphotographs of CTCL plaques (n = 23), AD (n = 12), and CS (n = 12). (H) Representative IF of karyopherin α2 in CD4+ T cells isolated from CTCL plaques and CS (n = 5). Arrows indicate coexpression of markers in the different staining. Error bars = SEM. *P < 0.05, **P < 0.01, ****P < 0.0001. Scale bars= 20 nm.
