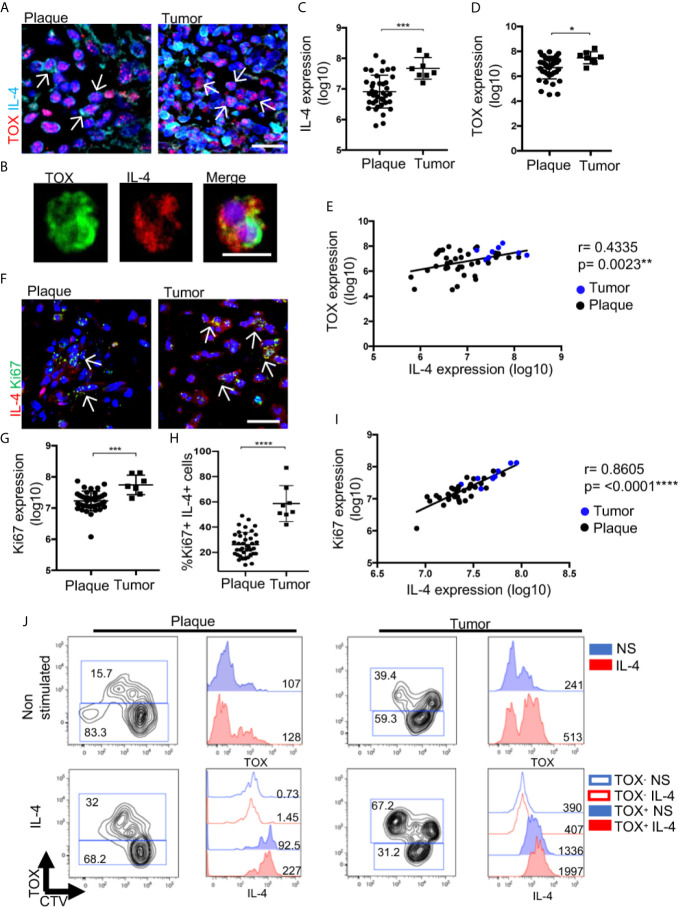
Figure 6.
IL-4 increases CTCL features associated with disease progression. (A) Representative immunofluorescence (IF) of TOX (AF-594) and IL-4 (AF-647) expression in CTCL plaques and tumors. (B) Representative microphotographs of CD4+ T cells isolated from tumors showing TOX (AF-488) and IL-4 (AF-594) expression (n = 3). Quantification of the total expression of (C) IL-4 and (D) TOX in the microphotographs of plaques (n = 39) and tumors (n = 8). (E) Correlation between IL-4 and TOX expression quantified from (A) (black dot: plaque; blue dot: tumor). (F) Representative IF of Ki67 (AF-488) and IL-4 (AF-594) expression in CTCL plaques and tumors. Quantification of the total expression of (G) Ki67 and (H) percentage of Ki67+ IL-4+ cells in the microphotographs of CTCL plaques (n = 39) and tumors (n = 8). (I) Correlation between IL-4 expression and Ki67 expression quantified from (F) (black dot: plaque; blue dot: tumor). (J) Flow cytometric analysis of CTCL plaques and tumor cells treated with IL-4. Left images show the proliferating CellTrace Violet mark (CTV) and percentage of TOX+ cells. Right images are representative histograms of nonstimulated cells (blue, NS) or IL-4-treated cells (red, IL-4) showing the expression of TOX and IL-4 from gated CD4+ TOX+ and CD4+ TOX- cells. Numbers represent MFI. Arrows of IF images indicate coexpression of markers in the different staining. Error bars = SEM. *P < 0.05; ***P < 0.001; ****P < 0.0001. Scale bars= 20 nm.

