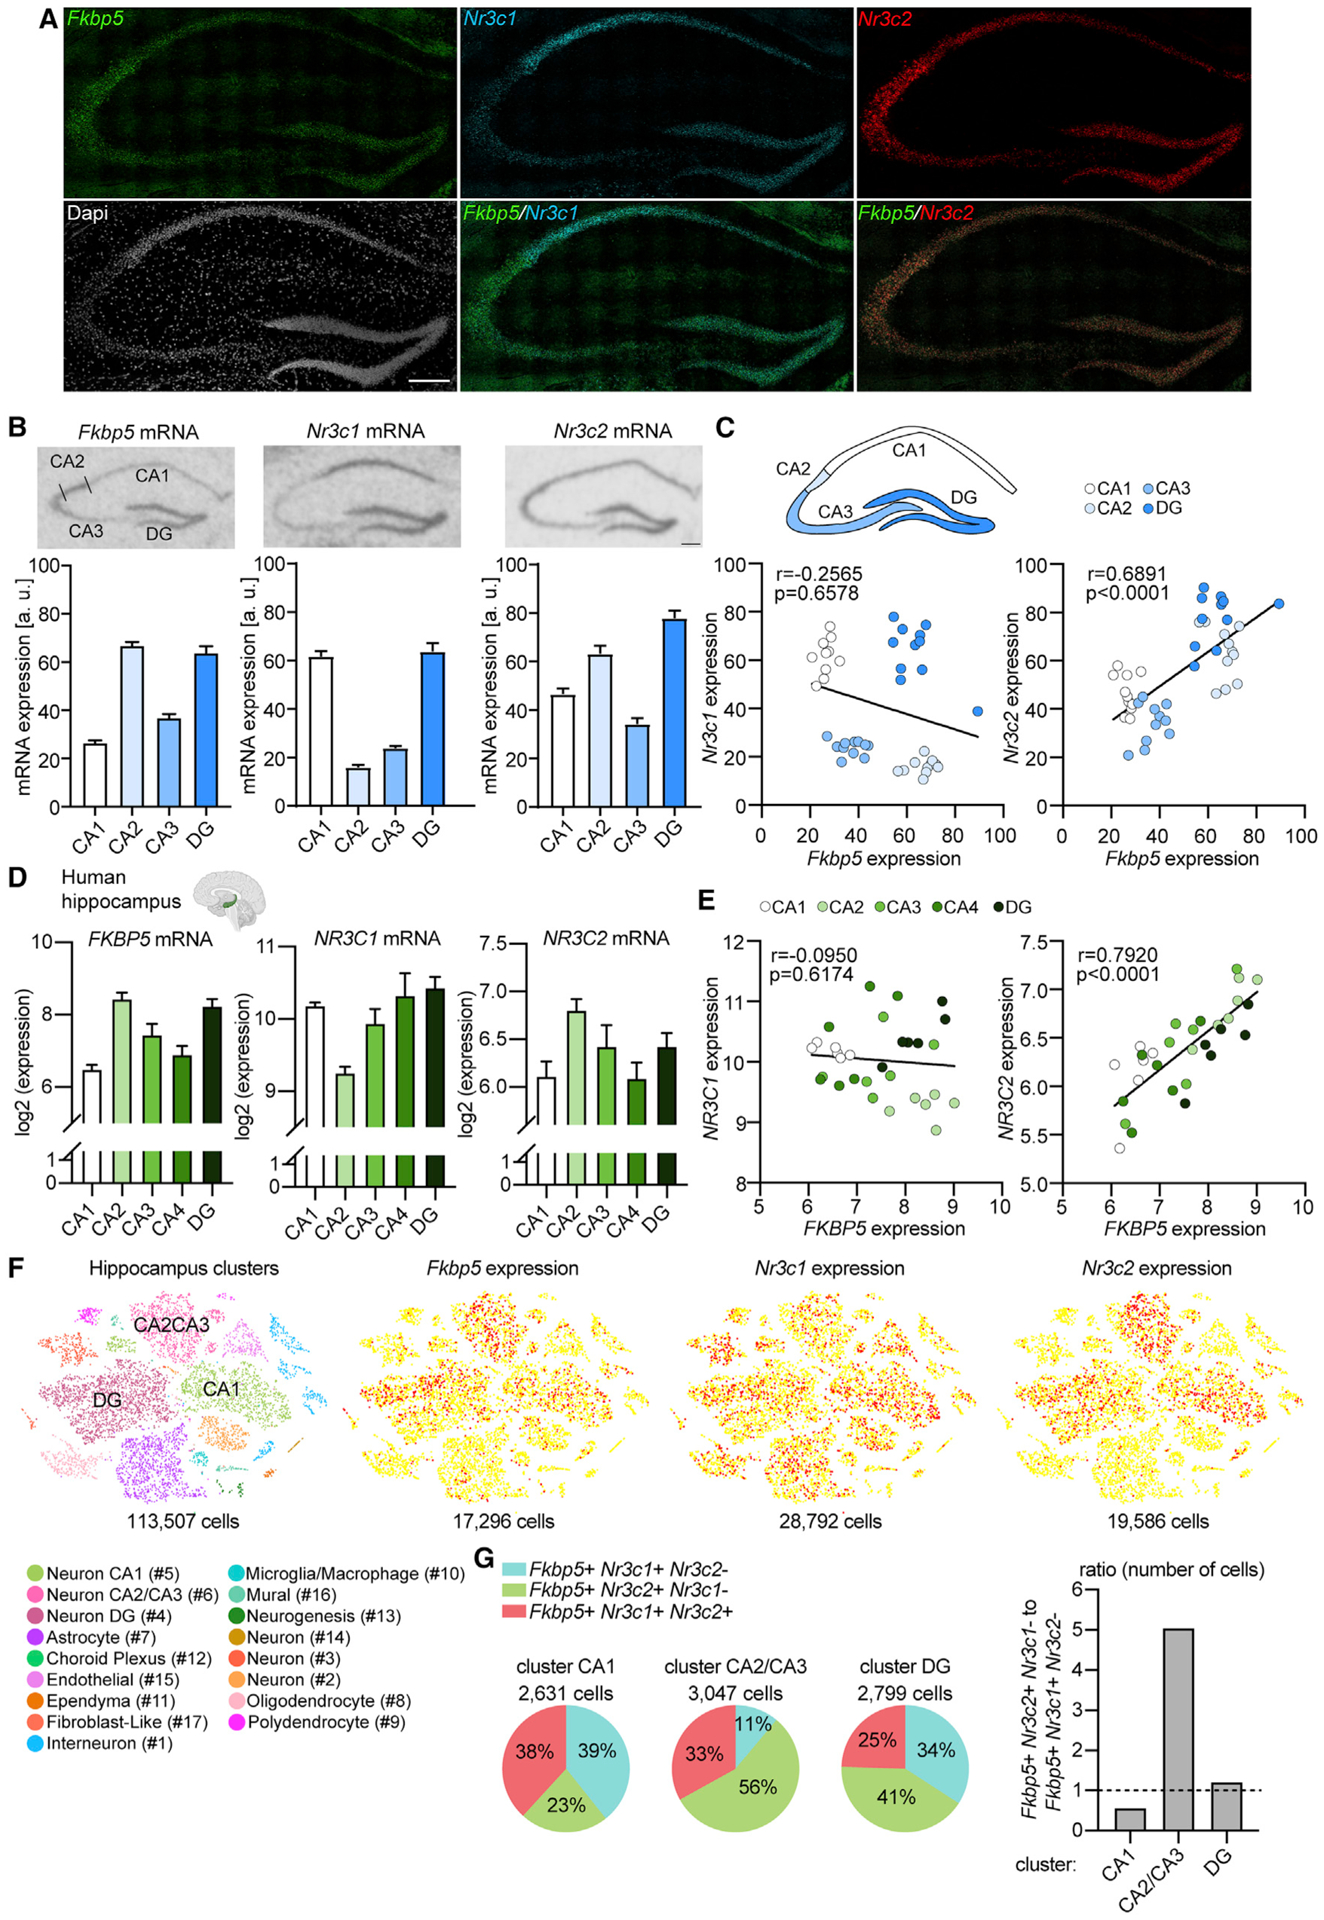
Figure 1. Fkbp5, Nr3c1, and Nr3c2 mRNA expression patterns in the human and mouse hippocampus.

(A) Fkbp5, Nr3c1, and Nr3c2 mRNA expression in the mouse hippocampus determined by RNAscope. Fkbp5 mRNA (green) and Nr3c2 mRNA (red) are strongly expressed in CA2 and dentate gyrus (DG). Nr3c1 mRNA (cyan) is prominently expressed in CA1 and DG. DAPI stain (gray) shows area examined. Overlay of Fkbp5 and Nr3c2 reveals strong overlap in expression of Fkbp5 and Nr3c2 specifically in the CA2. Fkbp5 and Nr3c1 expression does not show a high a degree of overlap in the CA1, CA2, or CA3. n = 4 mice. Scale bar, 250 μm.
(B) Hippocampal Fkbp5, Nr3c1 (glucocorticoid receptor [GR]), and Nr3c2 (mineralocorticoid receptor [MR]) mRNA expression determined by in situ hybridization (ISH) in C57BL/6J mice. Fkbp5 and Nr3c2 exhibit similar expression patterns in the hippocampus, which is distinct from that of Nr3c1. (Top panel) Representative autoradiographs of hippocampal Fkbp5, Nr3c1, and Nr3c2 mRNA expression. (Lower panel) Quantified expression of Fkbp5, Nr3c1, and Nr3c2 mRNA. Areas of interest are CA1, CA2, CA3, and DG. n = 11 mice. Scale bar, 250 μm.
(C) Correlation of Fkbp5 and Nr3c1 (left; Pearson correlation coefficient, r = −0.2565, p = 0.6578) or Nr3c2 (right; r = 0.6891, p < 0.0001) mRNA levels in hippocampal subregions CA1, CA2, CA3, and DG. Each dot represents the levels of Fkbp5 and the respective receptor in the same mouse.
(D) Microarray data from the Allen Brain Institute (Hawrylycz et al., 2012) showing FKBP5, NR3C1, and NR3C2 mRNA expression in human hippocampal subregions CA1, CA2, CA3, CA4, and DG. n = 6 subjects (see also Table S1).
(E) Correlation of FKBP5 and NR3C1 (left; Pearson correlation coefficient, r = −0.0950, p = 0.6174) or NR3C2 (right; r = 0.7920, p < 0.0001) mRNA levels in human hippocampal subregions CA1, CA2, CA3, CA4, and DG. Each dot represents the levels of FKBP5 and the respective receptor in one individual.
(F) Single-cell RNA sequencing data (Saunders et al., 2018) of the mouse hippocampus (n = 113,507 cells) depicts several different cell types (left) and the expression plots for Fkbp5, Nr3c1, and Nr3c2.
(G) Percentage of Fkbp5-positive cells expressing either only Nr3c1, only Nr3c2, or both receptors in individual neuronal clusters CA1, CA2/CA3, and DG (left). (Right) Ratio of the number of cells expressing Fkbp5 and only Nr3c2 to cells expressing Fkbp5 and only Nr3c1 in neuronal clusters CA1, CA2/CA3, and DG (Yates’ chi-square = 854.177; p < 2.2e–16). Data are presented as mean + SEM.
