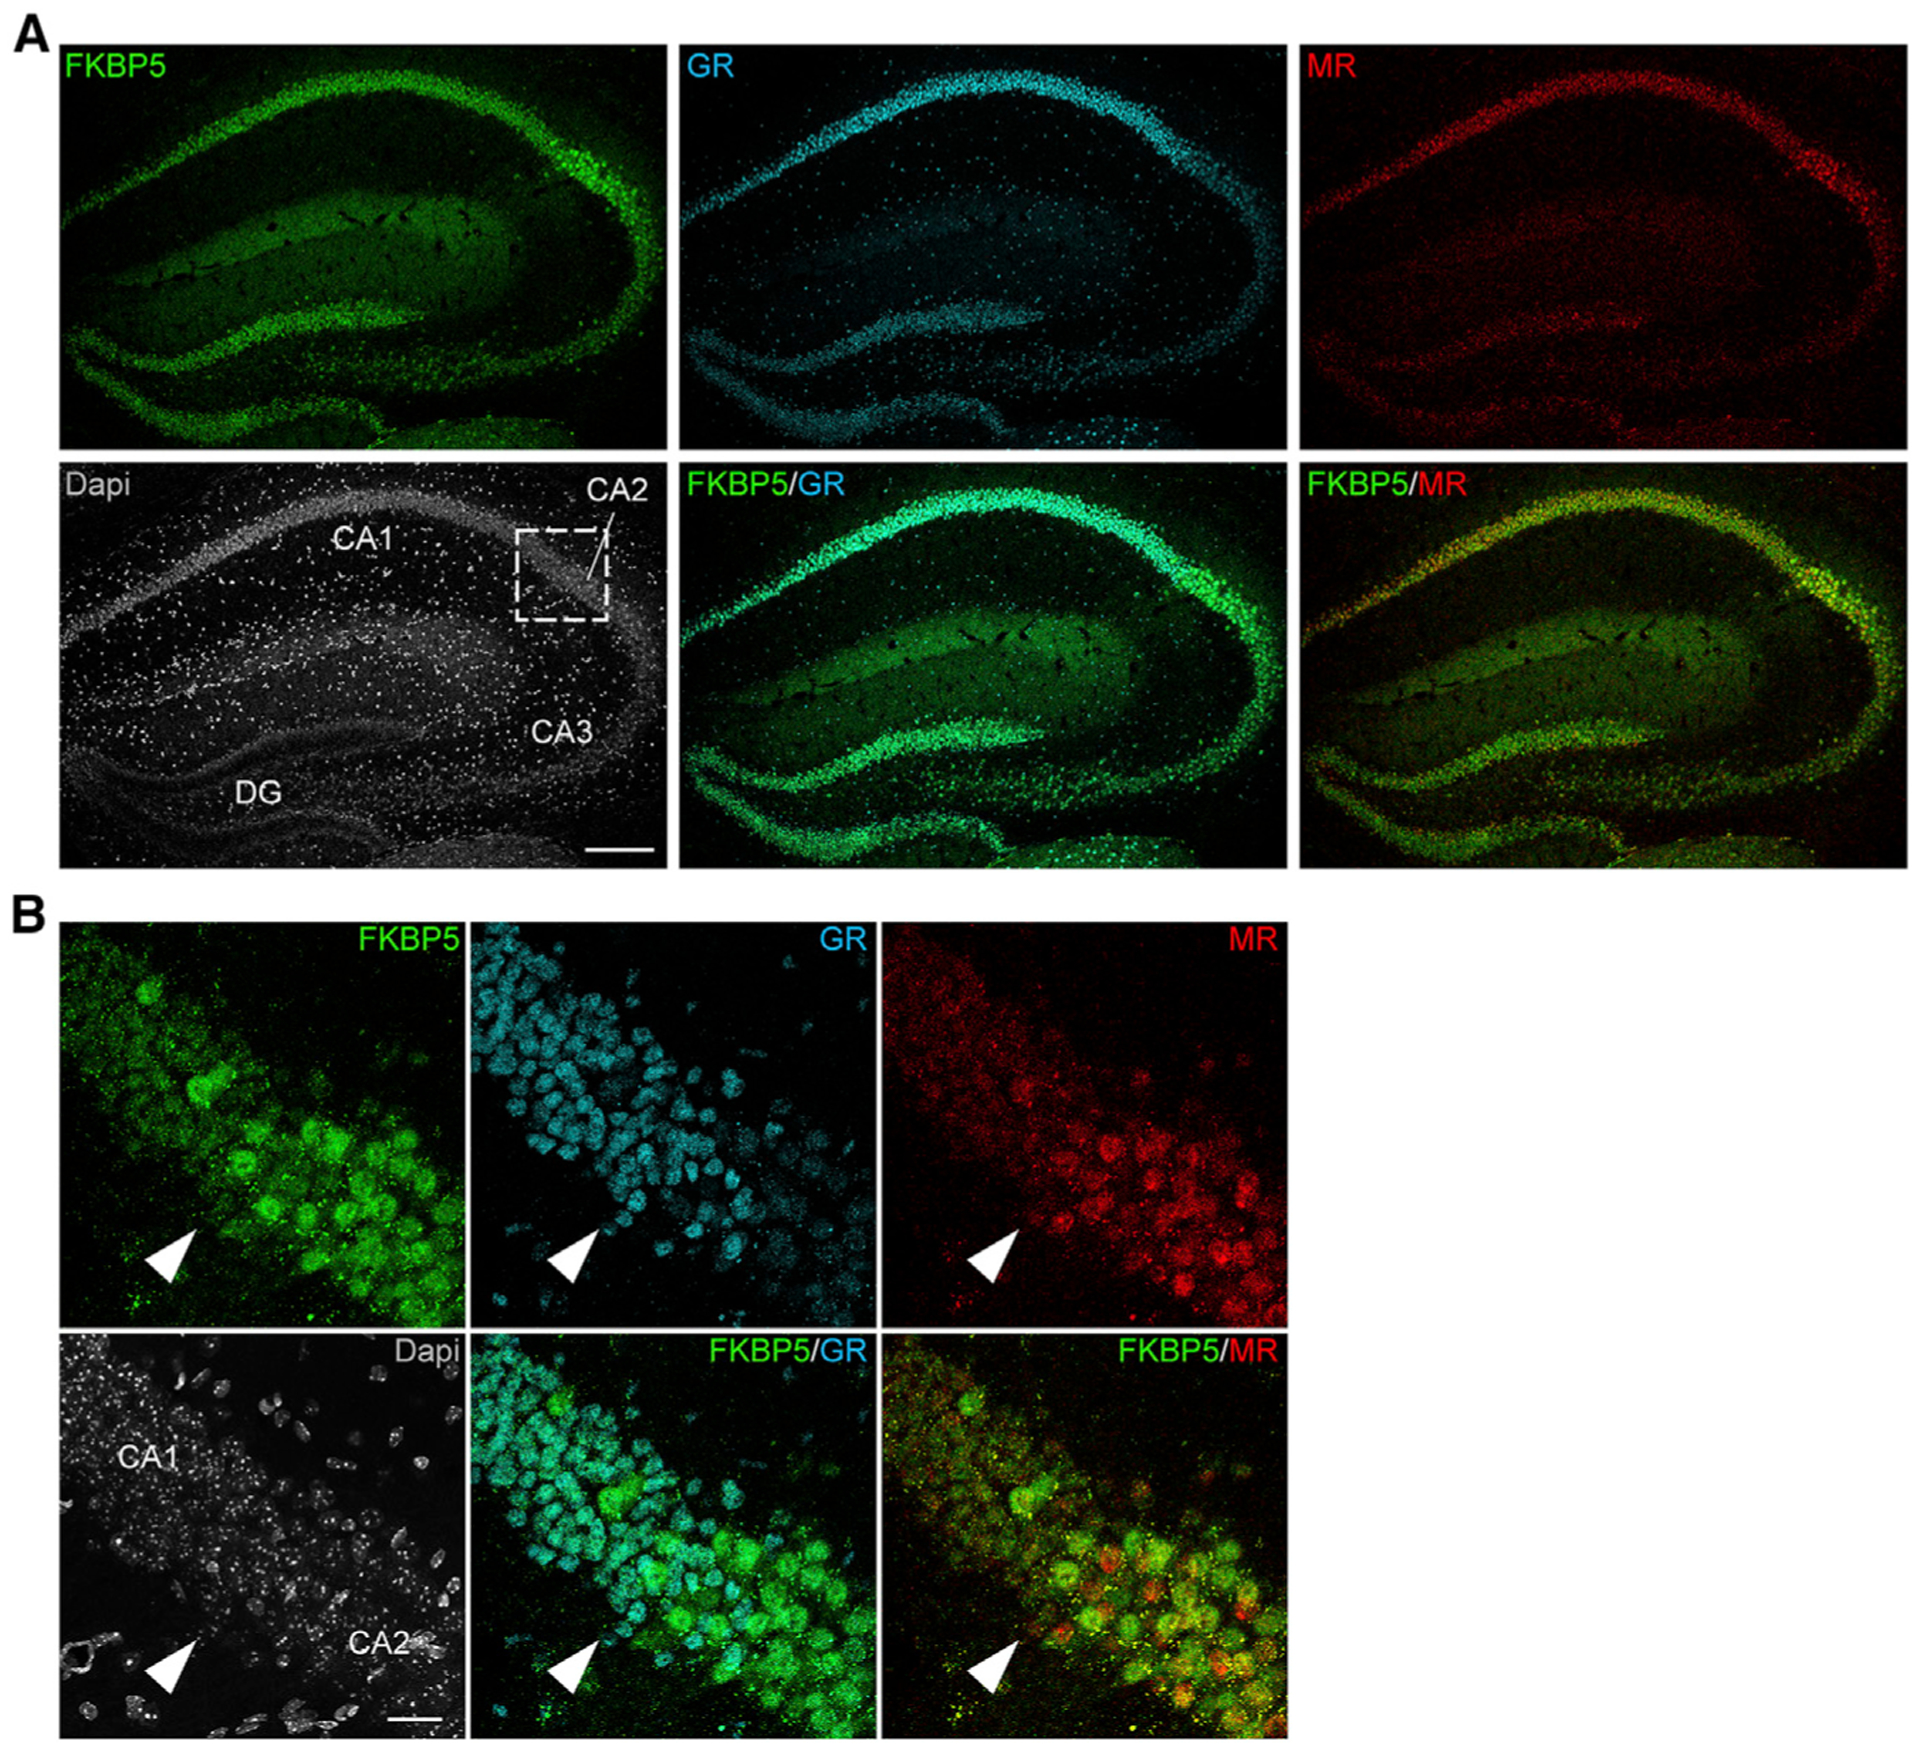
Figure 2. FKBP5, GR, and MR protein expression patterns in the mouse hippocampus.

(A) Coronal sections of C57BL/6J mice (n = 5) were stained for FKBP5 (FK506-binding protein 51), GR, and MR protein as well as DAPI (4′,6-diamidino-2-phenylindole). FKBP5 and MR exhibit similar expression patterns in the hippocampus, which is distinct from that of the GR. Scale bar, 250 μm.
(B) Higher magnification images of the approximate CA1–CA2 boundary (white arrow) in the hippocampus. FKBP5 and MR expression is most prominent in hippocampal subregion CA2, whereas GR expression is strongly expressed in the CA1. Scale bar, 25 μm. See also Figure S1.
