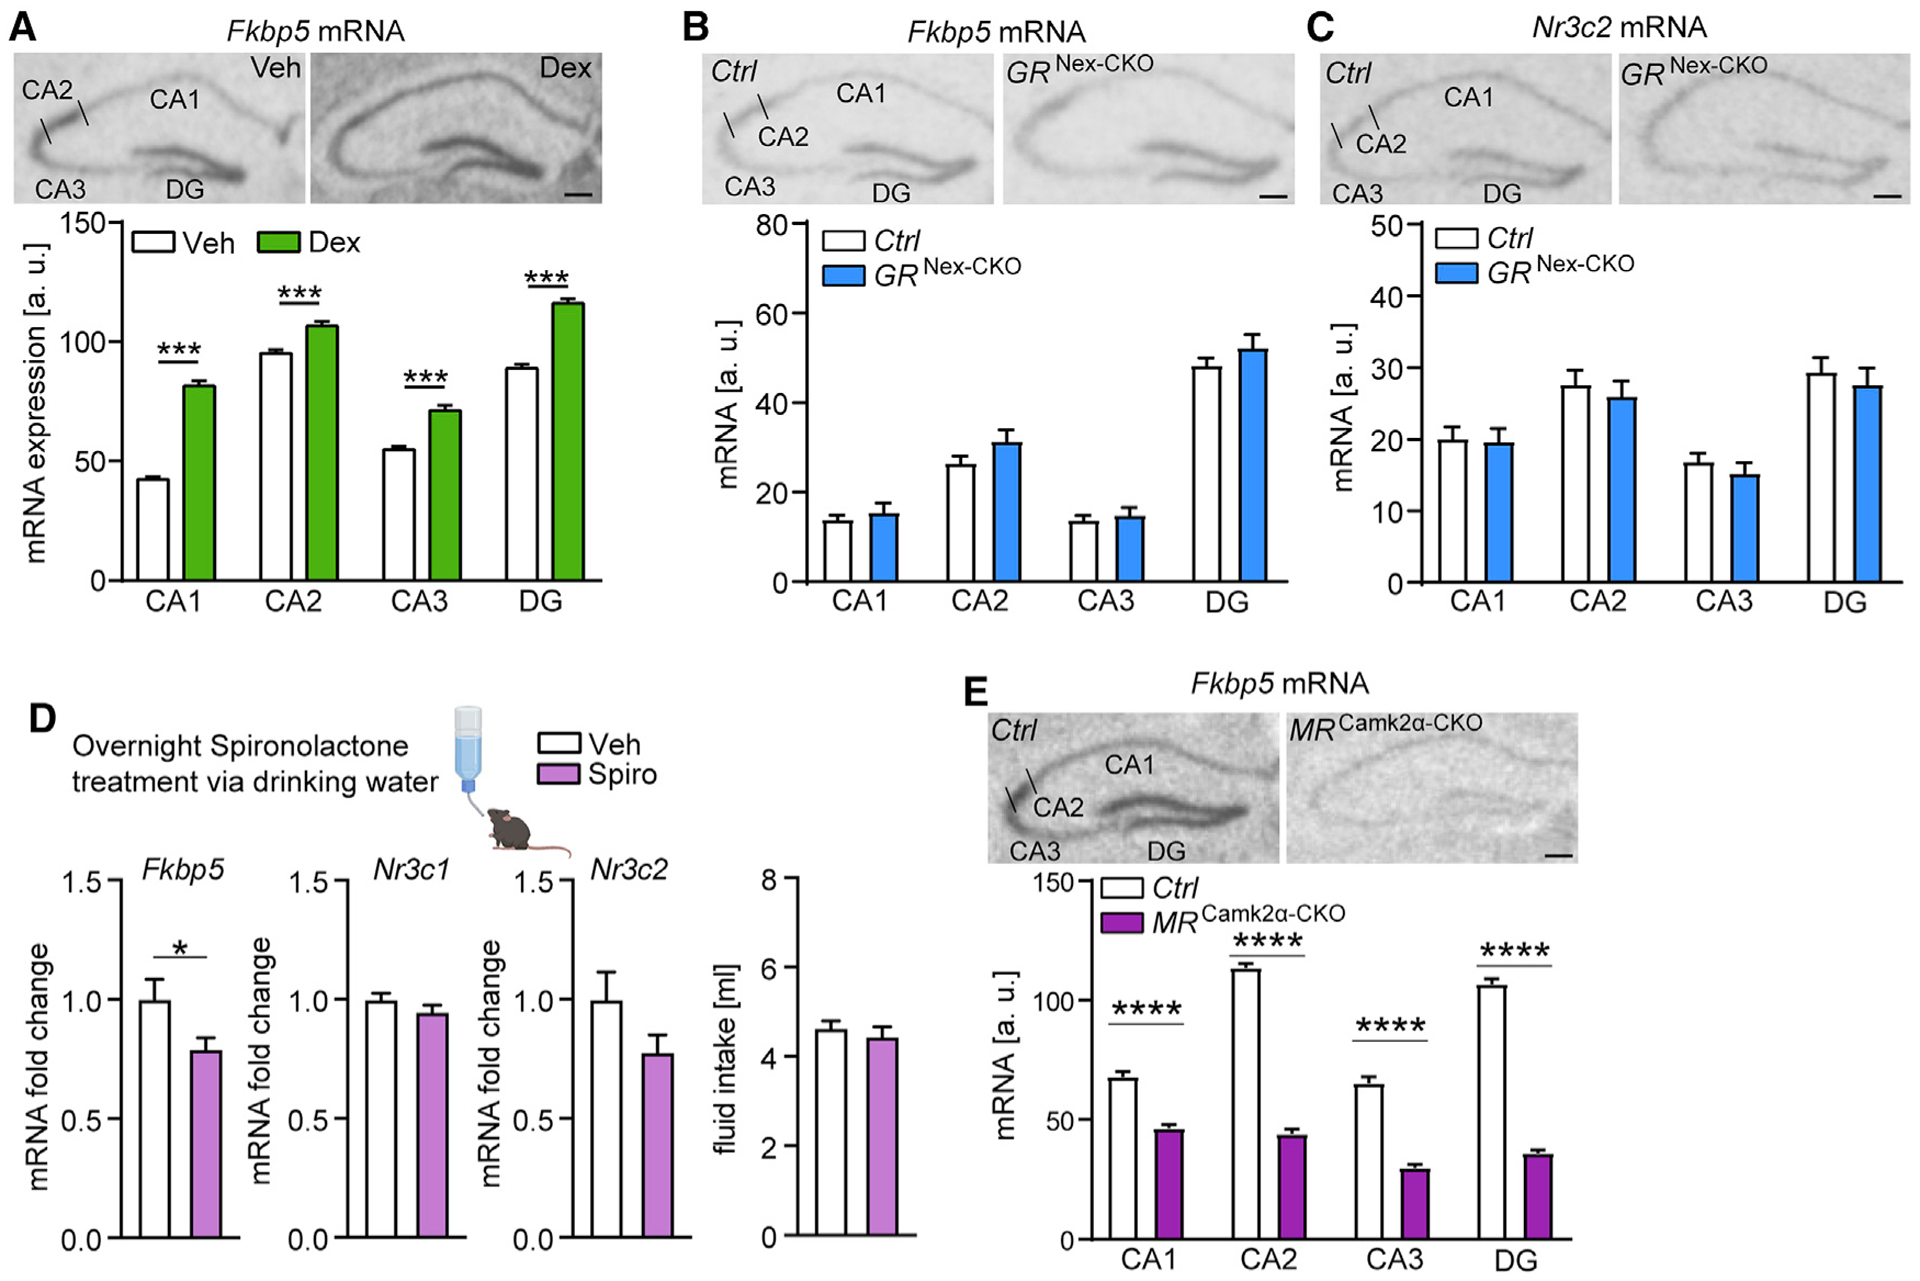
Figure 5. Basal Fkpb5 mRNA levels in the hippocampus are regulated by the MR.

(A) GR activation (Dex injection) leads to increased hippocampal Fkbp5 mRNA expression in C57BL/6J mice determined by ISH. (Top panel) Representative autoradiographs of hippocampal Fkbp5 mRNA expression. (Lower panel) Quantified expression of Fkbp5 mRNA (treatment-by-subregion interaction F3,180 = 25.72, p < 0.0001; n = 23–24 mice per group).
(B and C) No alterations in hippocampal Fkbp5 (B) and Nr3c2 (C) mRNA expression in glutamatergic GR knockout mice (n = 9–11 mice per group). (Top panel) Representative autoradiographs of hippocampal Fkbp5 or Nr3c2 mRNA expression determined by ISH. (Lower panel) Quantified expression of Fkbp5 or Nr3c2 mRNA.
(D) Fkbp5 mRNA expression is decreased in the hippocampus of C57BL/6J mice following overnight treatment with the MR antagonist spironolactone (Fkbp5, t19 = 2.108, p < 0.05; n = 10–11 mice per group), while Nr3c1 and Nr3c2 mRNA levels are not altered. Overnight fluid intake did not differ between vehicle- and spironolactone-treated mice.
(E) MR deletion in forebrain neurons (MRCamk2α-CKO) leads to lower hippocampal Fkbp5 mRNA expression determined by ISH (genotype-by-hippocampal subregion interaction F3,88 = 77.2, p < 0.0001; n = 10–14 mice per group). (Top panel) Representative autoradiographs of hippocampal Fkbp5 mRNA expression. (Lower panel) Quantified expression of Fkbp5 mRNA.
Areas of interest are CA1, CA2, CA3, and DG. Two-way ANOVA + Bonferroni post hoc test and unpaired, two-tailed Student’s t test for simple comparisons: *p < 0.05, ***p < 0.001, ****p < 0.0001. Data are presented as mean + SEM. Scale bars, 250 μm. See also Figures S2 and S3.
