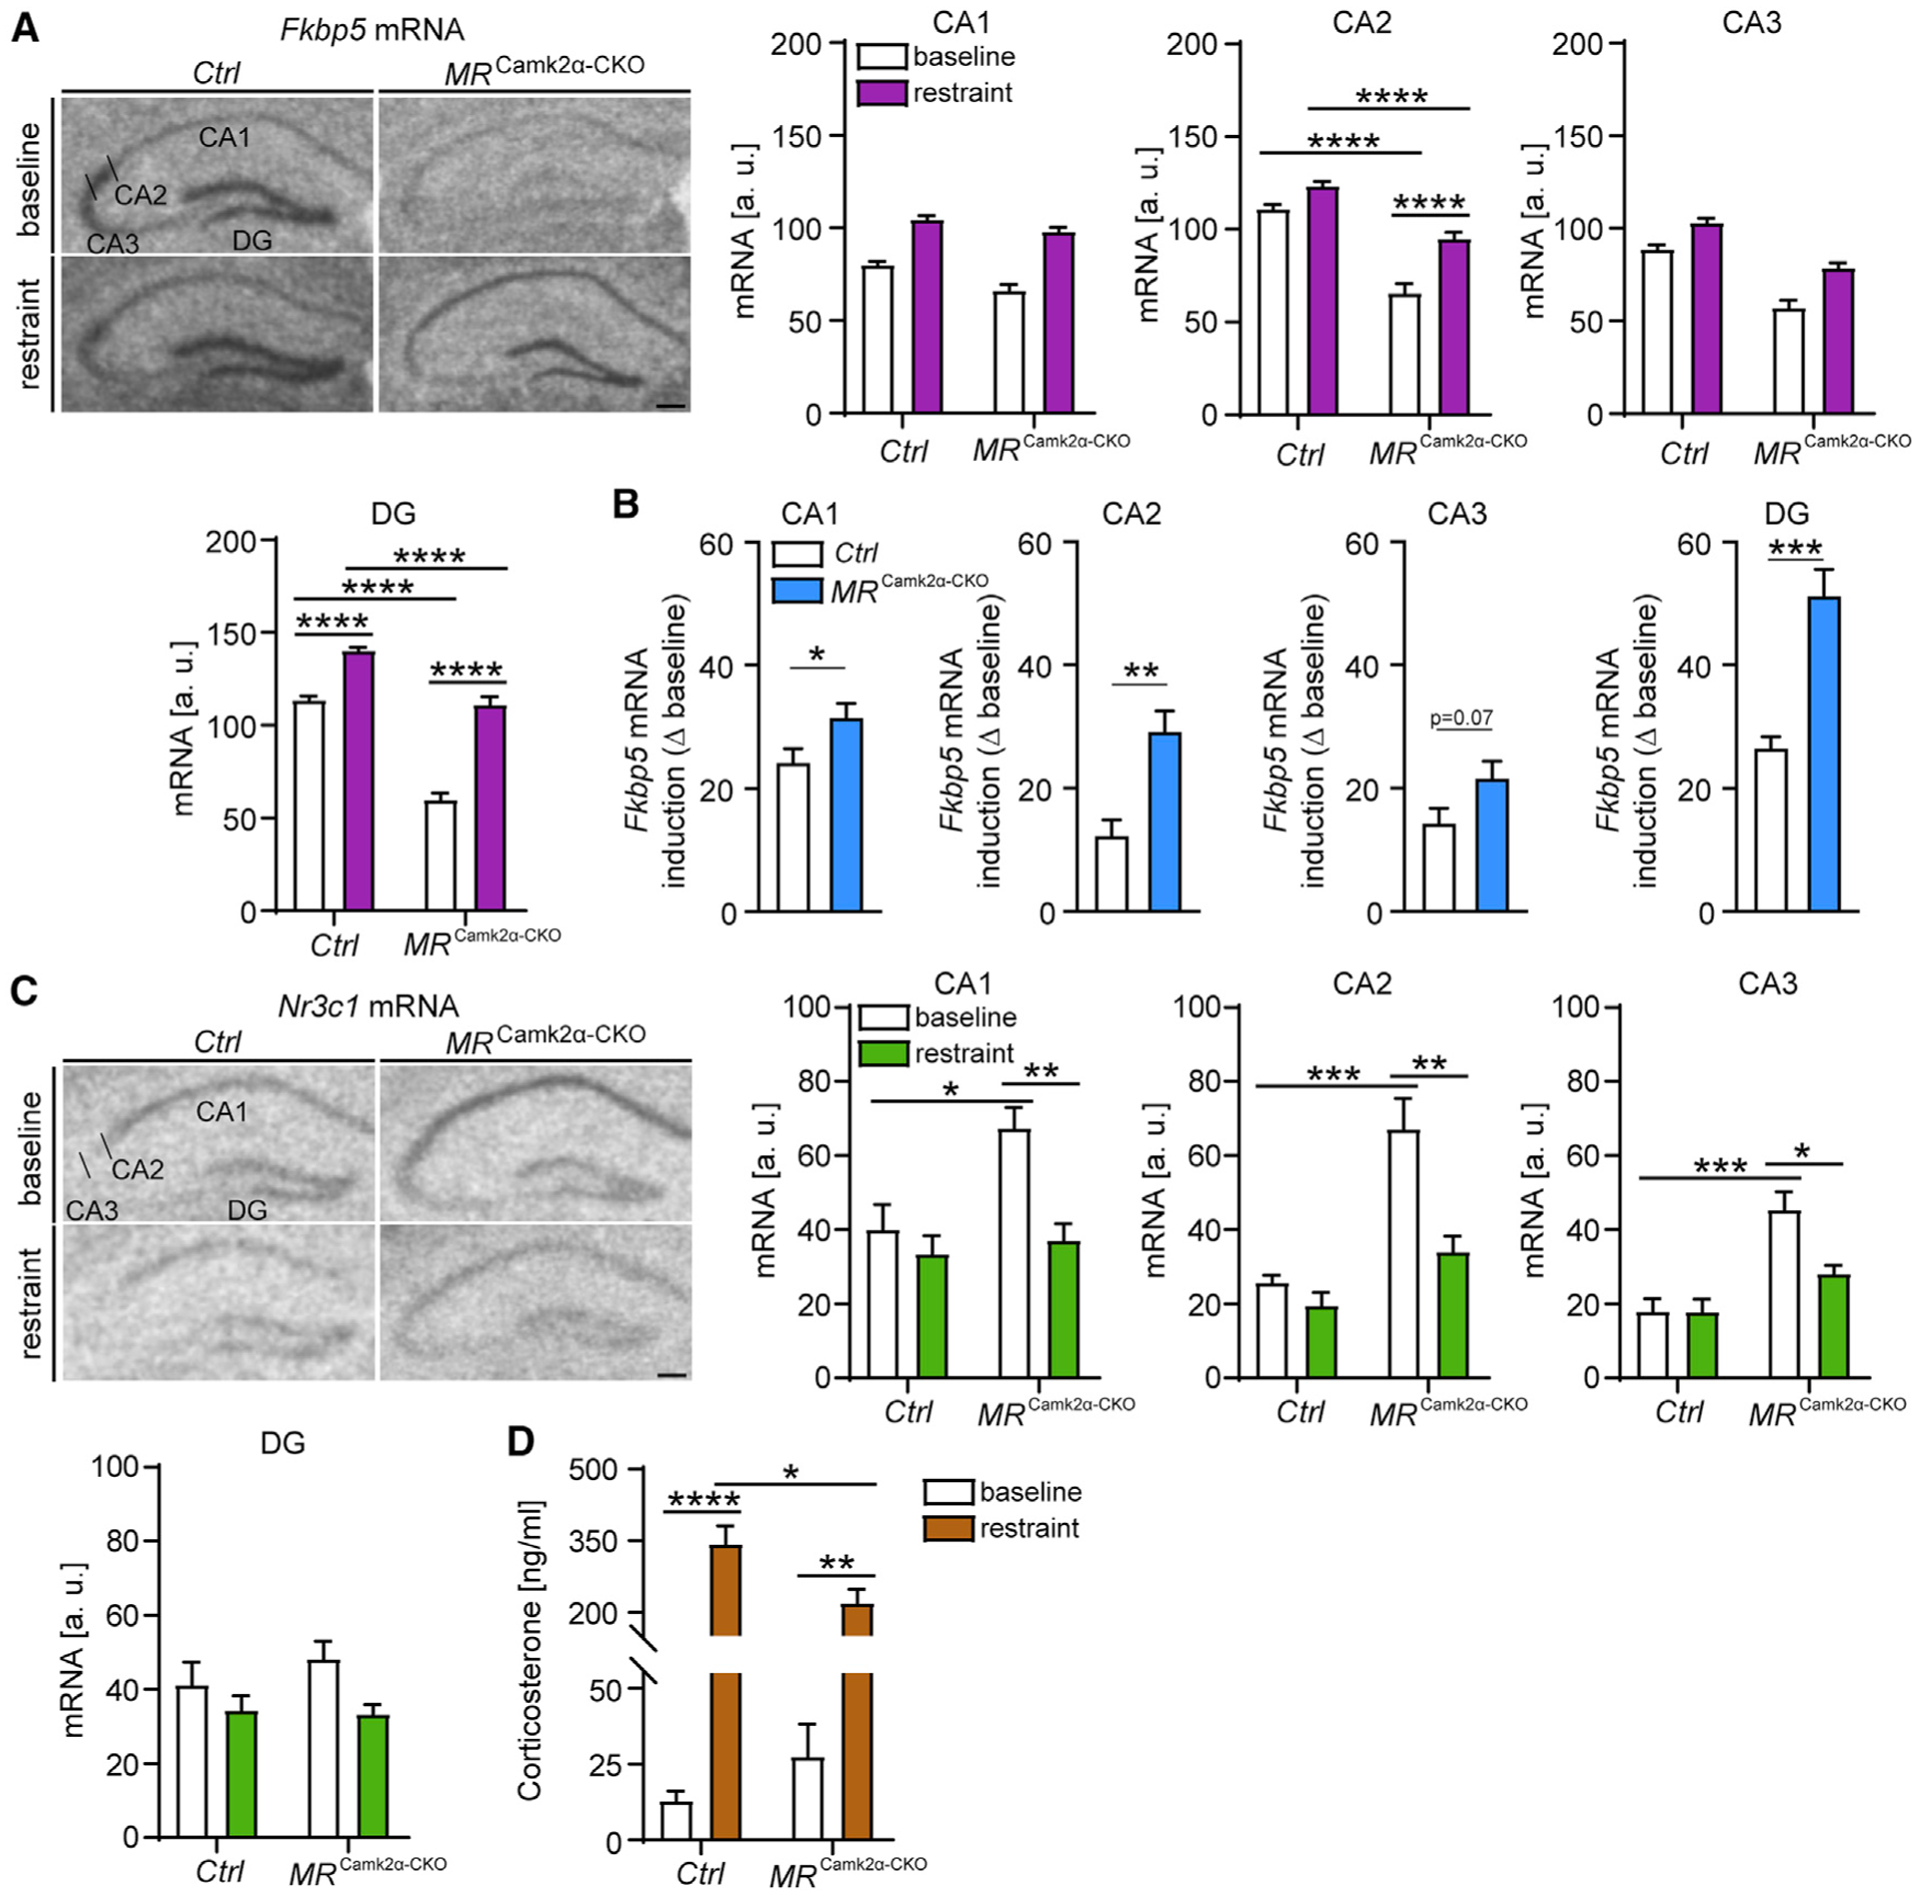
Figure 6. Forebrain-specific MR deletion leads to GR hypersensitivity during the acute stress response.

(A) (Left) Representative autoradiographs of hippocampal Fkbp5 mRNA expression in MRCamk2α-CKO mice. CA1, CA2, CA3, and DG show quantified expression of Fkbp5 mRNA. Fkbp5 levels are decreased in the CA1, CA2, CA3, and DG of conditional forebrain MR knockout mice. 4 h of restraint stress increases Fkbp5 expression in the hippocampus, which is even more pronounced in MRCamk2α-CKO mice (CA1: main condition effect, F1,21 = 137.8, p < 0.0001; main genotype effect, F1,21 = 18.03, p < 0.001; CA2: genotype-by-condition interaction, F1,21 = 6.183, p < 0.05; CA3: main condition effect, F1,21 = 36.71, p < 0.0001; main genotype effect, F1,21 = 88.06, p < 0.0001; DG: genotype-by-condition interaction, F1,21 = 16.5, p < 0.001).
(B) The induction of Fkbp5 mRNA by 4-h restraint stress (delta to baseline) in CA1, CA2, and DG of MRCamk2α-CKO mice is increased compared to littermate controls (CA1, t11 = 2.315, p < 0.05; CA2, t11 = 4.179, p < 0.01; CA3, t11 = 2.01, p = 0.07; DG, t11 = 5.717, p < 0.0001).
(C) (Left) Representative autoradiographs of hippocampal Nr3c1 mRNA expression in MRCamk2α-CKO mice. CA1, CA2, CA3, and DG show quantified expression of Nr3c1 mRNA. Nr3c1 levels are increased in the CA1, CA2, and CA3 of conditional forebrain MR knockout mice under baseline conditions. In contrast, 4 h of restraint stress decreases Nr3c1 expression in the hippocampus of MRCamk2α-CKO mice, while no changes are observed in littermate controls (CA1: genotype-by-condition interaction, F1,19 = 4.794, p < 0.05; CA2: genotype-by-condition interaction, F1,19 = 6.144, p < 0.05; CA3: genotype-by-condition interaction, F1,19 = 5.399, p < 0.05). No significant changes in Nr3c1 mRNA expression were observed in the DG.
(D) 4 h of restraint stress leads to increased corticosterone levels, an effect that is significantly blunted in in MRCamk2α-CKO mice (genotype-by-condition interaction, F1,19 = 6.228, p < 0.05).
Two-way ANOVA + Bonferroni post hoc test and unpaired, two-tailed Student’s t test for simple comparisons: *p < 0.05, **p < 0.01, ***p < 0.001, ****p < 0.0001. Data are presented as mean + SEM; n = 4–7 mice per group. Scale bars, 250 μm.
