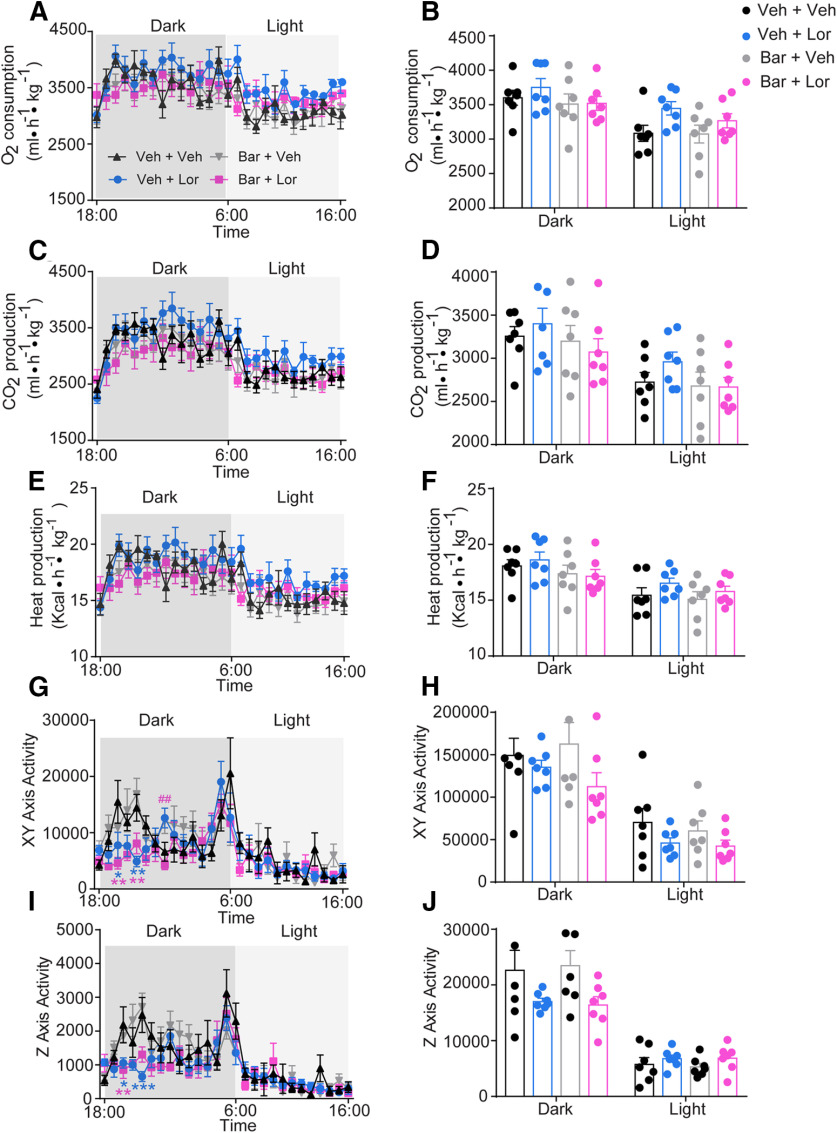
Figure 3.
Bar does not change energy expenditure and physical activity. A, C, E, G, I, Temporal changes in oxygen consumption (A), carbon dioxide production (C), heat production (E), xy-axis activity (G), and z-axis activity (I) in Veh + Veh, Veh + Lor, Bar + Veh, and Bar + Lor groups. N = 7 mice per group. Data are presented as mean ± SEM. Two-way repeated measures ANOVA, [dot]VO2: time × group (dark phase: F(39,234) = 1.43, p = 0.058; light phase: F(36,216) = 1.23, p = 0.19); [dot]VCO2: time × group (dark phase: F(39,234) = 1.42, p = 0.065; light phase: F(36,216) = 1.24, p = 0.18); heat: time × group (dark phase: F(39,234) = 1.44, p = 0.056; light phase: F(36,216) = 1.24, p = 0.18); heat: time × group (dark phase: F(39,234) = 1.44, p = 0.056; light phase: F(36,216) = 1.24, p = 0.18); xy-axis activity: time × group (dark phase: F(39,234) = 2.26, p < 0.0001; light phase: F(36,216) = 0.967, p = 0.53); z-axis activity: time × group (dark phase: F(39,234) = 2.01, p = 0.0008; light phase: F(36,216) = 0.94, p = 0.58), with post hoc Sidak's multiple comparisons test. *p < 0.05, **p < 0.01, ***p < 0.001. N = 7 mice per group. Data are presented as mean ± SEM. B, D, F, H, J, Average dark and light oxygen consumption (B), carbon dioxide production (D), heat production (F), xy-axis activity (H), and z-axis activity (J) in Veh + Veh, Veh + Lor, Bar + Veh, and Bar + Lor groups. Two-way ANOVA, Lor × Bar: ([dot]VO2: dark phase: F(1,24) = 0.32, p = 0.57; light phase: F(1,24) = 0.58, p = 0.45; [dot]VCO2: dark phase: F(1,24) = 0.71, p = 0.41; light phase: F(1,24) = 0.95, p = 0.34; heat: dark phase: F(1,24) = 0.33, p = 0.57; light phase: F(1,24) = 0.10, p = 0.74; xy-axis activity: dark phase: F(1,24) = 0.93, p = 0.34; light phase: F(1,24) = 0.08, p = 0.78; Y-axis activity: dark phase: F(1,24) = 0.09, p = 0.76; light phase: F(1,24) = 0.10, p = 0.75), with post hoc Sidak's multiple comparisons test. N = 7 mice per group. Data are presented as mean ± SEM with individual data points.

