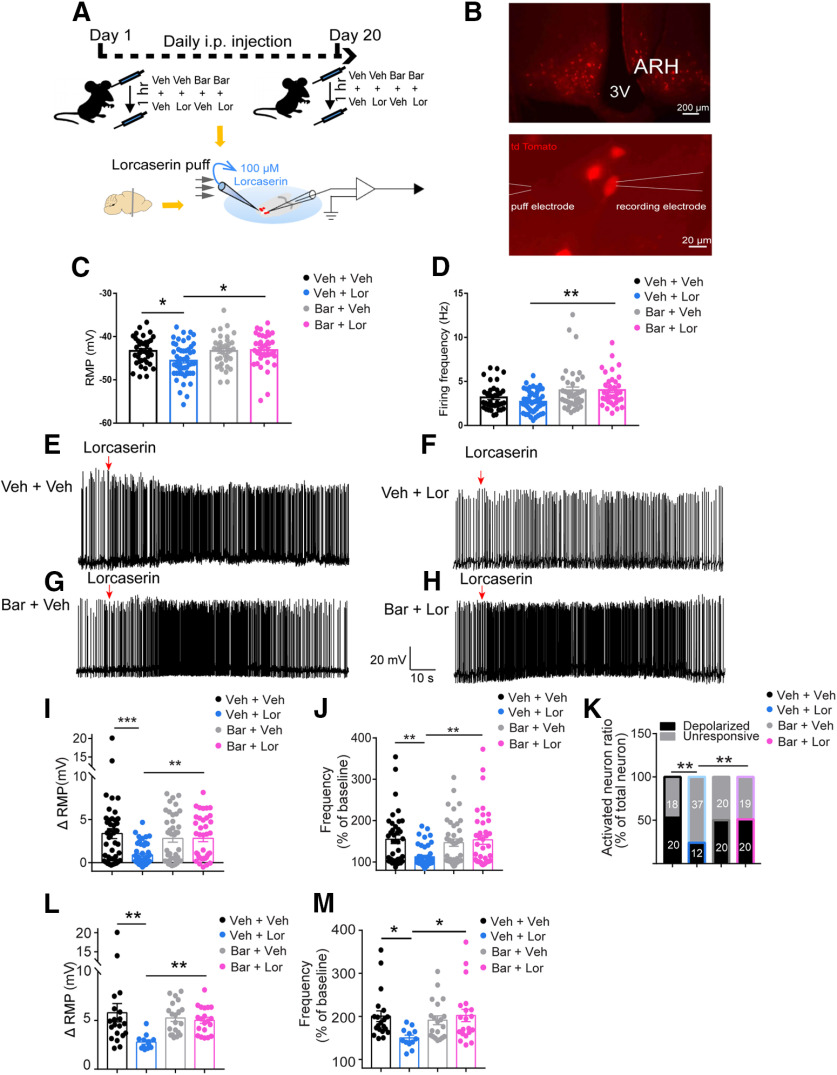
Figure 5.
Bar maintains POMCARH neuron responses to Lor puff in vitro. A, Experimental scheme. B, tdTomato fluorescent labeled POMC neurons in the ARH (upper panel) and positioning of puff and recording electrodes as illustrated by white lines. C, Quantification of RMP in all recorded neurons in various groups before Lor treatment. Two-way ANOVA, Lor × Bar: F(1,163) = 4.65, p = 0.033, with post hoc Sidak's multiple comparisons test. *p < 0.05. N = 38–52 neurons per group from at least 3 mice. Data are presented as mean ± SEM with individual data points. D, Quantification of firing rate in all recorded neurons in various groups before Lor treatment. Two-way ANOVA, Lor × Bar: F(1,163) = 0.98, p = 0.32, with post hoc Sidak's multiple comparisons test. **p < 0.05. N = 38–52 neurons per group from at least 3 mice. Data are presented as mean ± SEM with individual data points. E–H, Representative traces of action firing potential in POMCARH neurons before and after Lor treatment (100 μm, 5-s puff) in Veh + Veh (E), Veh + Lor (F), Bar + Veh (G), and Bar + Lor (H) groups. I, Change in membrane potential in all recorded neurons treated by Lor in various groups. Two-way ANOVA, Lor × Bar: F(1,162) = 7.24, p = 0.0079, with post hoc Sidak's multiple comparisons test. **p < 0.01, ***p < 0.001. N = 38–49 neurons per group from at least 3 mice. Data are presented as mean ± SEM with individual data points. J, Changes in firing rate in all recorded neurons treated by Lor in various groups. Two-way ANOVA, Lor × Bar: F(1,162) = 8.58, p = 0.0039, with post hoc Sidak's multiple comparisons test. **p < 0.01. N = 38–49 neurons per group from at least 3 mice. K, Percentage of neurons with depolarization or no response induced by Lor in various groups. χ2 test; **p < 0.01. L, Magnitude of depolarization in activated neurons induced by Lor in various groups. Two-way ANOVA, Lor × Bar: F(1,68) = 5.18, p = 0.026, with post hoc Sidak's multiple comparisons test. **p < 0.01. N = 12–20 neurons per group from at least 3 mice. Data are presented as mean ± SEM with individual data points. M, Changes in firing rate in activated neurons induced by Lor in various groups. Two-way ANOVA, Lor × Bar: F(1,68) = 5.68, p = 0.02; with post hoc Sidak's multiple comparisons test. *p < 0.05. N = 12–20 neurons per group from at least 3 mice. Data are presented as mean ± SEM with individual data points.

