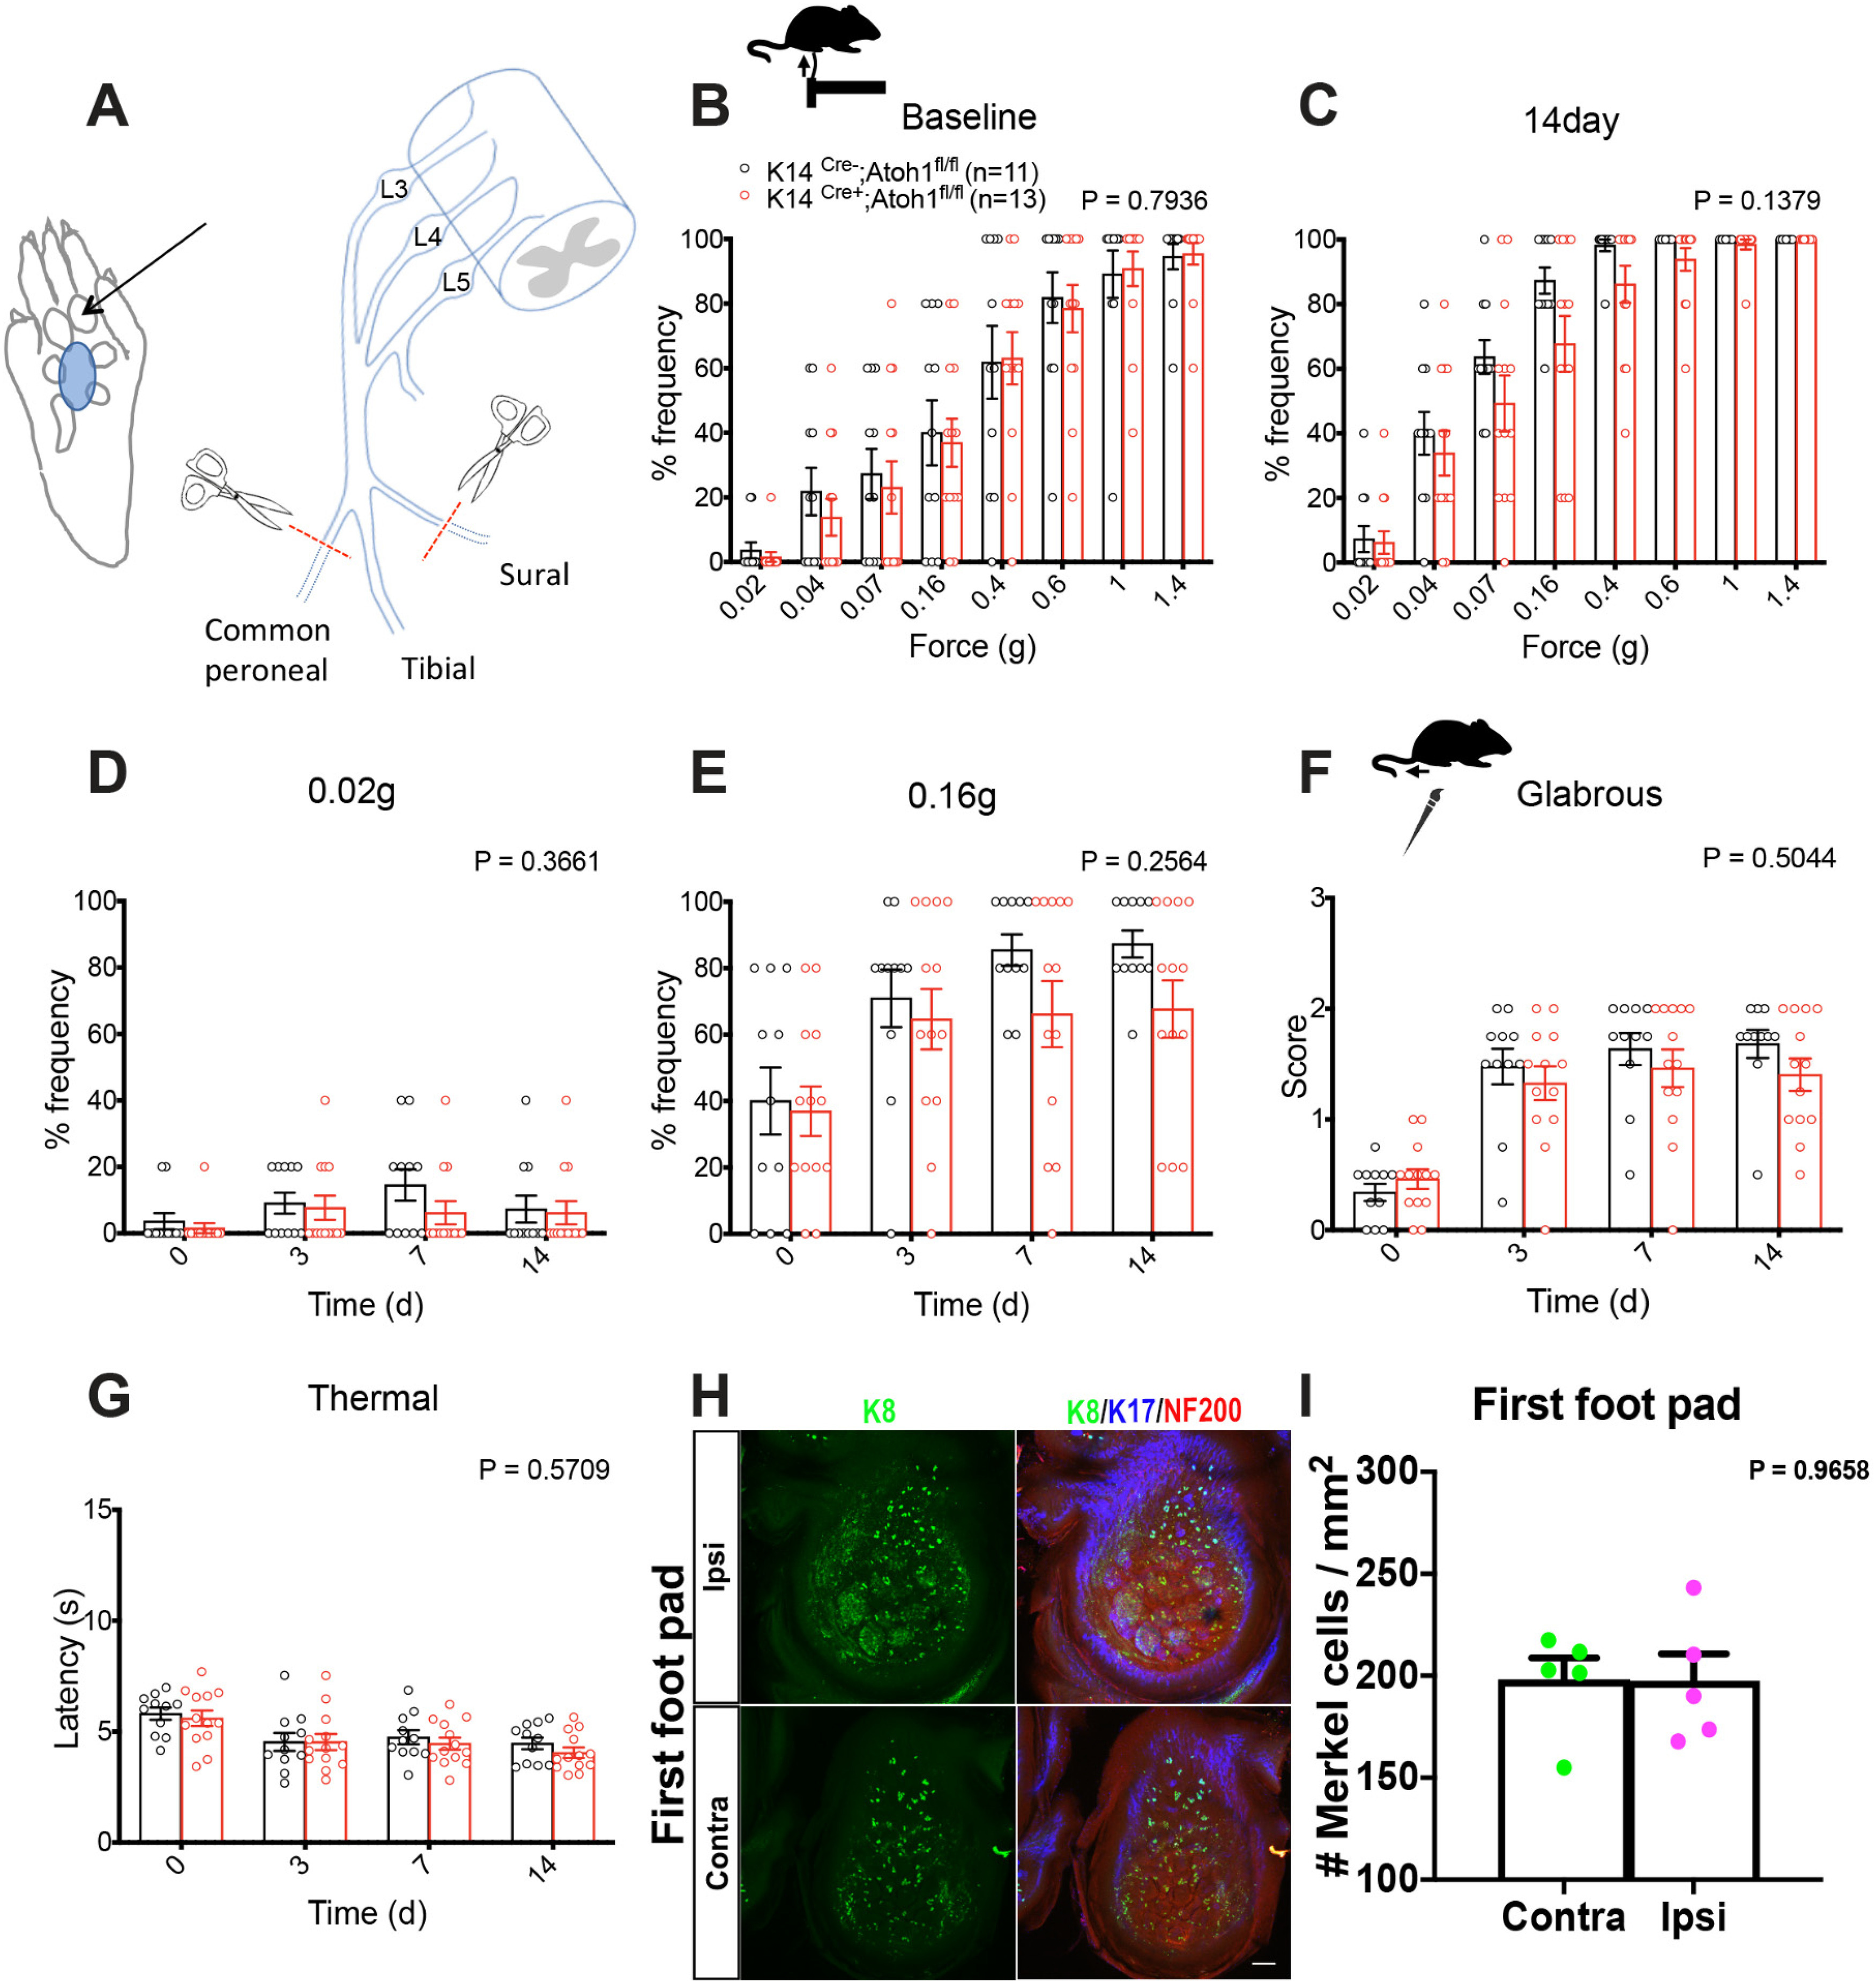
Figure 11.

Mechanical sensitivity and Merkel cell density in the spared territory of male mice in the SNIt model. A, Right, Schematic diagram of SNIt injury model, showing the three branches of the sciatic nerve (common peroneal, tibial, and sural). Left, Area tested in behavioral assays shown in blue. Arrow indicates first foot pad. B–E, Punctate mechanical sensitivity measured across forces in the ipsilateral tibial nerve-innervated hind paw skin at baseline (B) and 14 d after SNIt (C) and time course of hind paw sensitivity to 0.02 g (D) and 0.16 g (E) von Frey filaments in K14Cre+;Atoh1fl/fl and Cre-negative Atoh1fl/fl control male mice in the SNIt model. F, Time course of brush-evoked dynamic mechanical sensitivity in the ipsilateral tibial nerve-innervated plantar hind paw skin in K14Cre+;Atoh1fl/fl and Cre-negative control male mice in the SNIt model. G, Time course of thermal sensitivity in the ipsilateral tibial nerve-innervated plantar hind paw skin in K14Cre+;Atoh1fl/fl and Cre-negative Atoh1fl/fl control male mice in the SNIt model. B-G, Data are mean ± SEM. p value for overall comparison between genotypes over time or force using two-way ANOVA shown at the top and number of mice in parentheses. H, Whole-mount immunostaining for K8 (green), K17 (blue), and NF200 (red) in the contralateral and ipsilateral first foot pad at 14 d after SNIt. Scale bar, 100 µm. I, Quantification of Merkel cell density in contralateral (green) and ipsilateral (magenta) first foot pad. Data are mean ± SEM. p value from paired Student's t test shown at the top. n = 5 mice.
