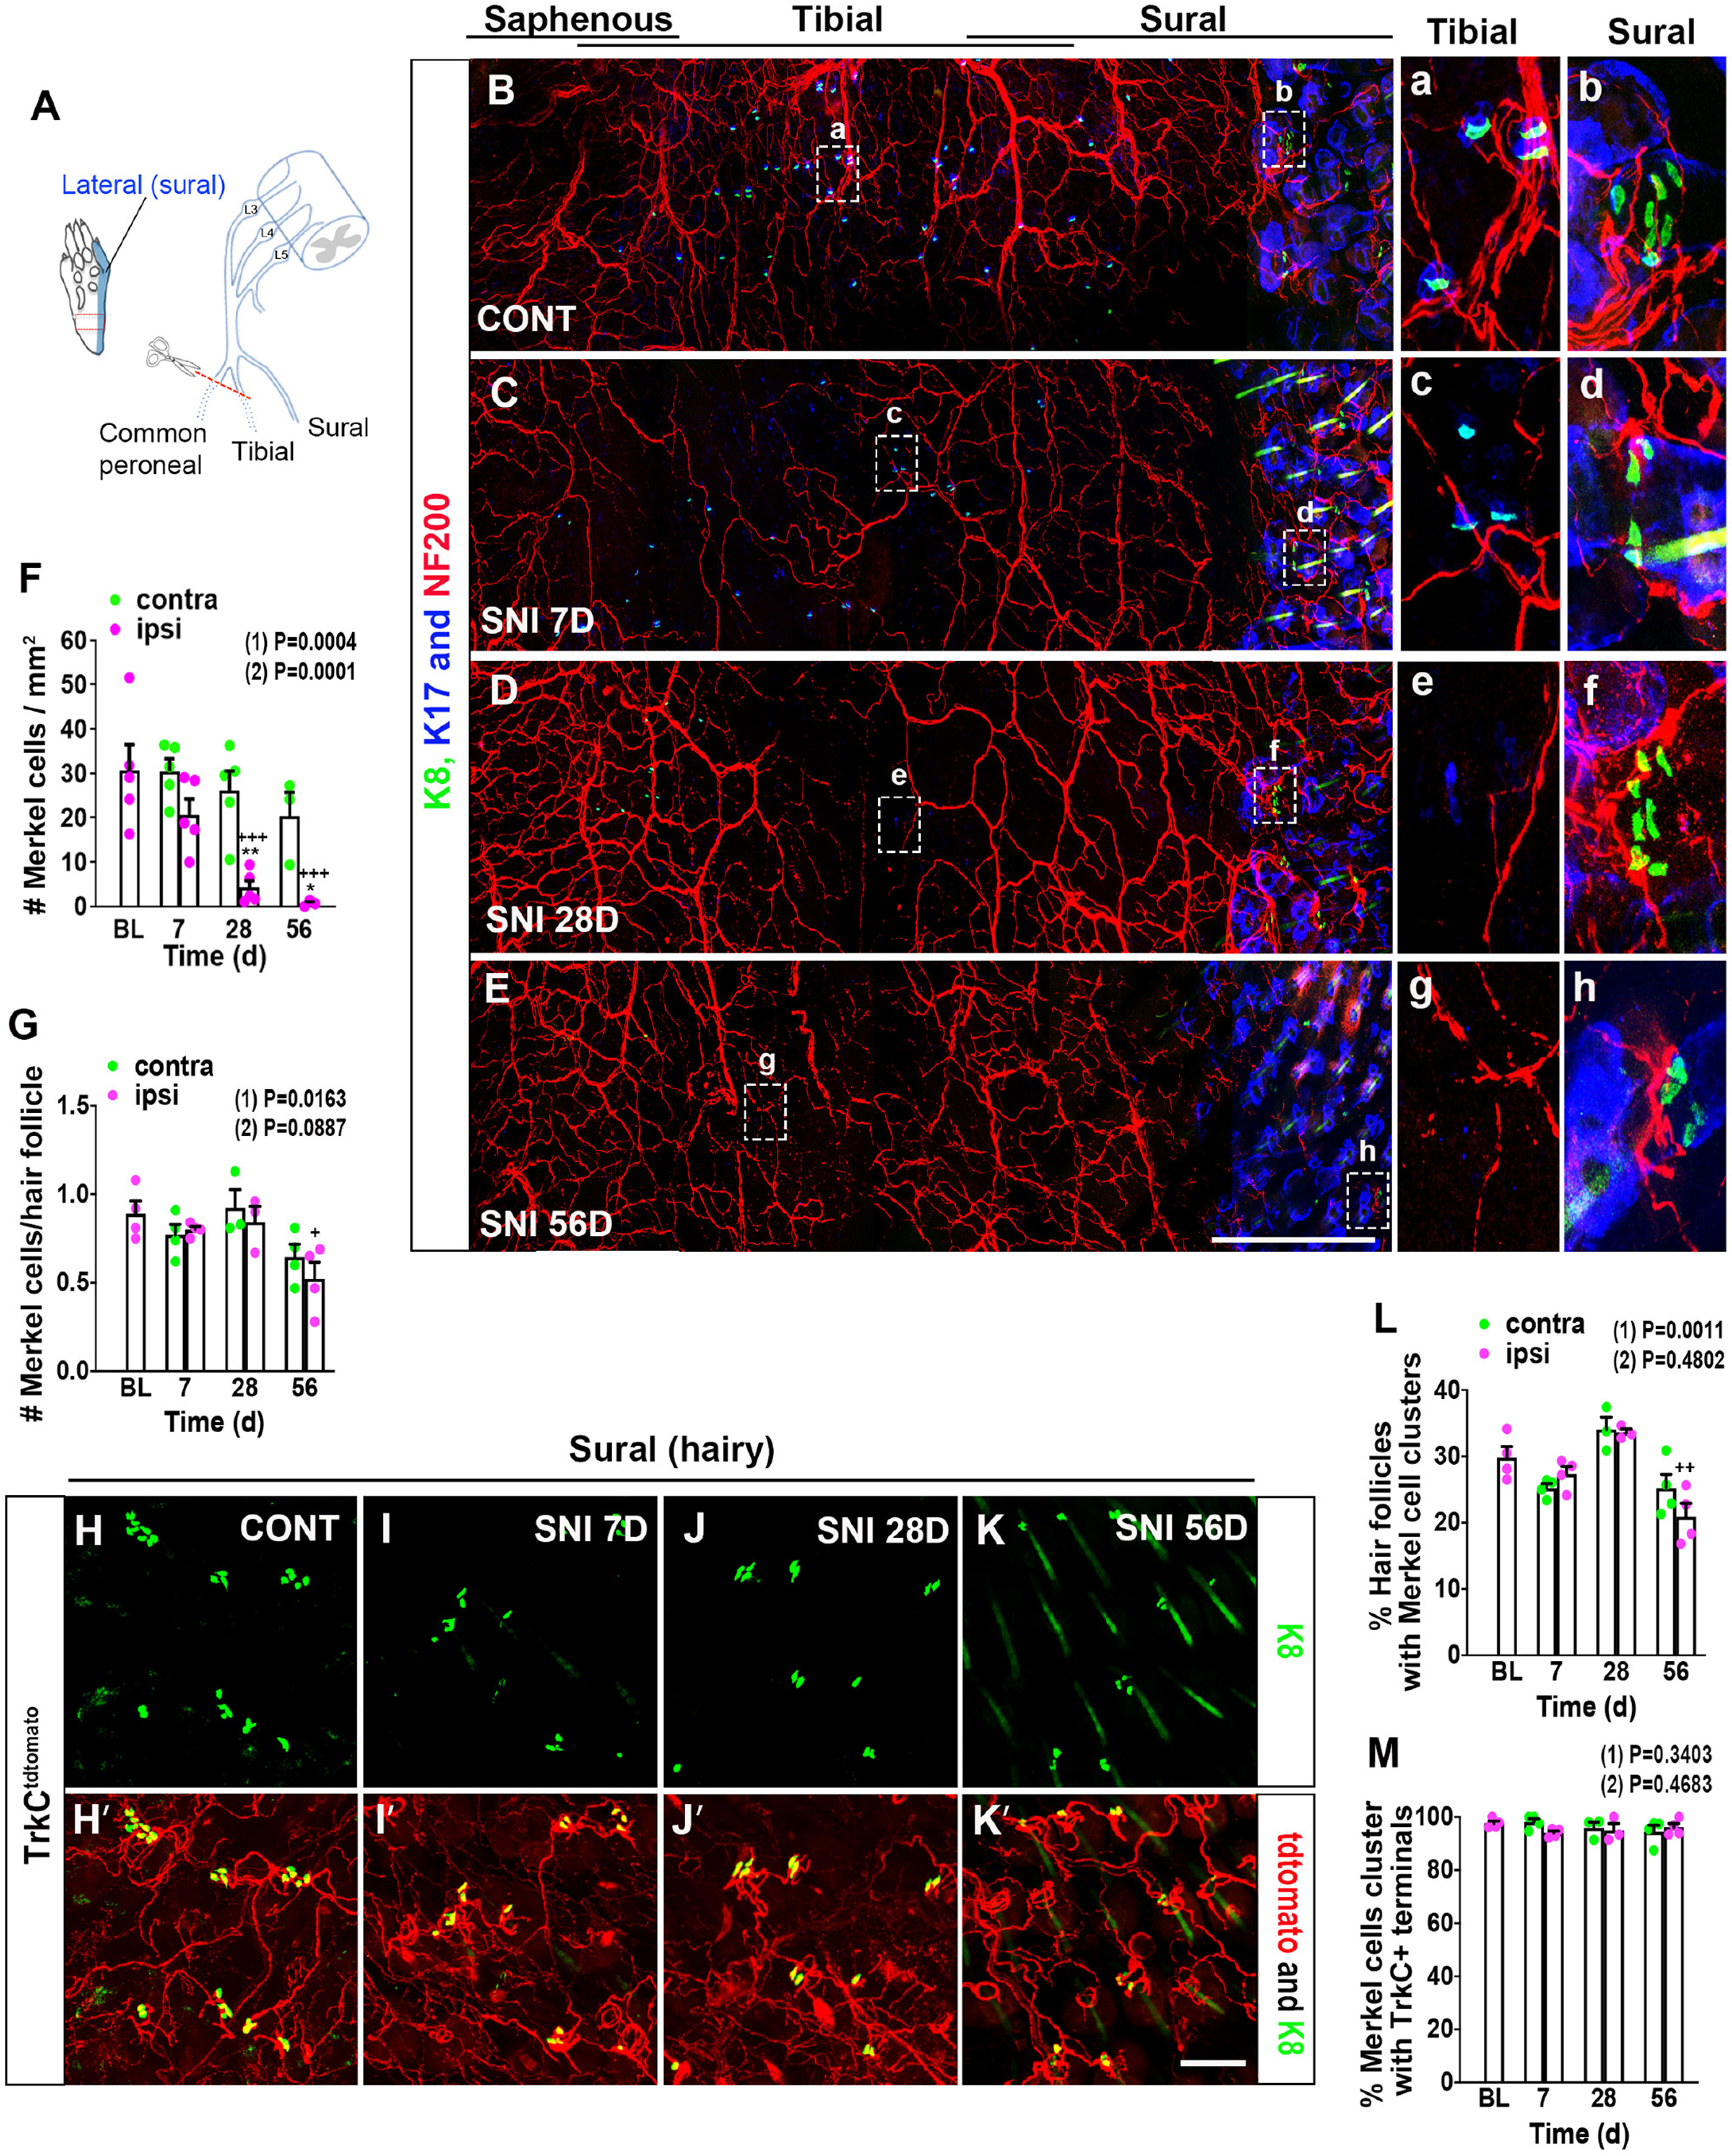
Figure 2.

Abundance and distribution of hind paw Merkel cells and associated nerve endings in male mice after peripheral nerve injury. A, Schematic diagram of SNI injury model, showing the three branches of the sciatic nerve (common peroneal, tibial, and sural) and the lateral plantar area (blue) of hind paw innervated by sural afferents. Red box represents area examined further in B-E. B–E, Whole-mount immunostaining for K8 (green), K17 (blue), and NF200 (red) on the contralateral (B) and ipsilateral (C) hind paw on day 7, and ipsilateral hind paw on day 28 (D) and 56 (E) after SNI surgery. Right, Insets, Amplified views of the areas of the middle (tibial nerve innervation territory; a, c, e, and g) and hairy lateral (sural nerve innervation territory; b, d, f, and h) areas of hind paw, respectively, indicated by the dashed boxes. Scale bar, 500 µm. F, Quantification of Merkel cell numbers in contralateral (green) and ipsilateral (magenta) hind paw plantar skin (proximal to foot pads) at the indicated times after SNI (n = 3-5). BL, Baseline. G, Quantification of the mean number of Merkel cells per hair follicle in the lateral hairy skin of the contralateral (green) and ipsilateral (magenta) hind paw after SNI (n = 3 or 4). H–K, In TrkCtdtomato mice, whole-mount immunostaining for K8 (green) and tdTomato (red) in the hairy lateral area of contralateral (H,H′) and ipsilateral (I,I′) hind paws on day 7, and ipsilateral hind paw on day 28 (J,J′) and day 56 (K,K′) after SNI. Insets, Merkel cells associated with TrkCtdtomato+ nerve endings. Scale bar, 100 µm. L, Quantification of the percentage of hair follicles associated with Merkel cells in the lateral hairy skin of the contralateral (green) and ipsilateral (magenta) hind paws after SNI (n = 3 or 4). M, Quantification of the percentage of K8+ Merkel cell clusters in close proximity to TrkCtdtomato+ nerve endings in the lateral hairy skin of the contralateral (green) and ipsilateral (magenta) hind paws after SNI (n = 3 or 4). Data are mean ± SEM. (1) Overall p value from one-way ANOVA of ipsilateral paw data over time. Results of Bonferroni post hoc correction: +p < 0.05; ++p < 0.01; +++p < 0.001. (2) Overall p value for difference between ipsilateral and contralateral paws over time using two-way ANOVA. Results of Bonferroni post hoc correction: *p < 0.05; **p < 0.01.
