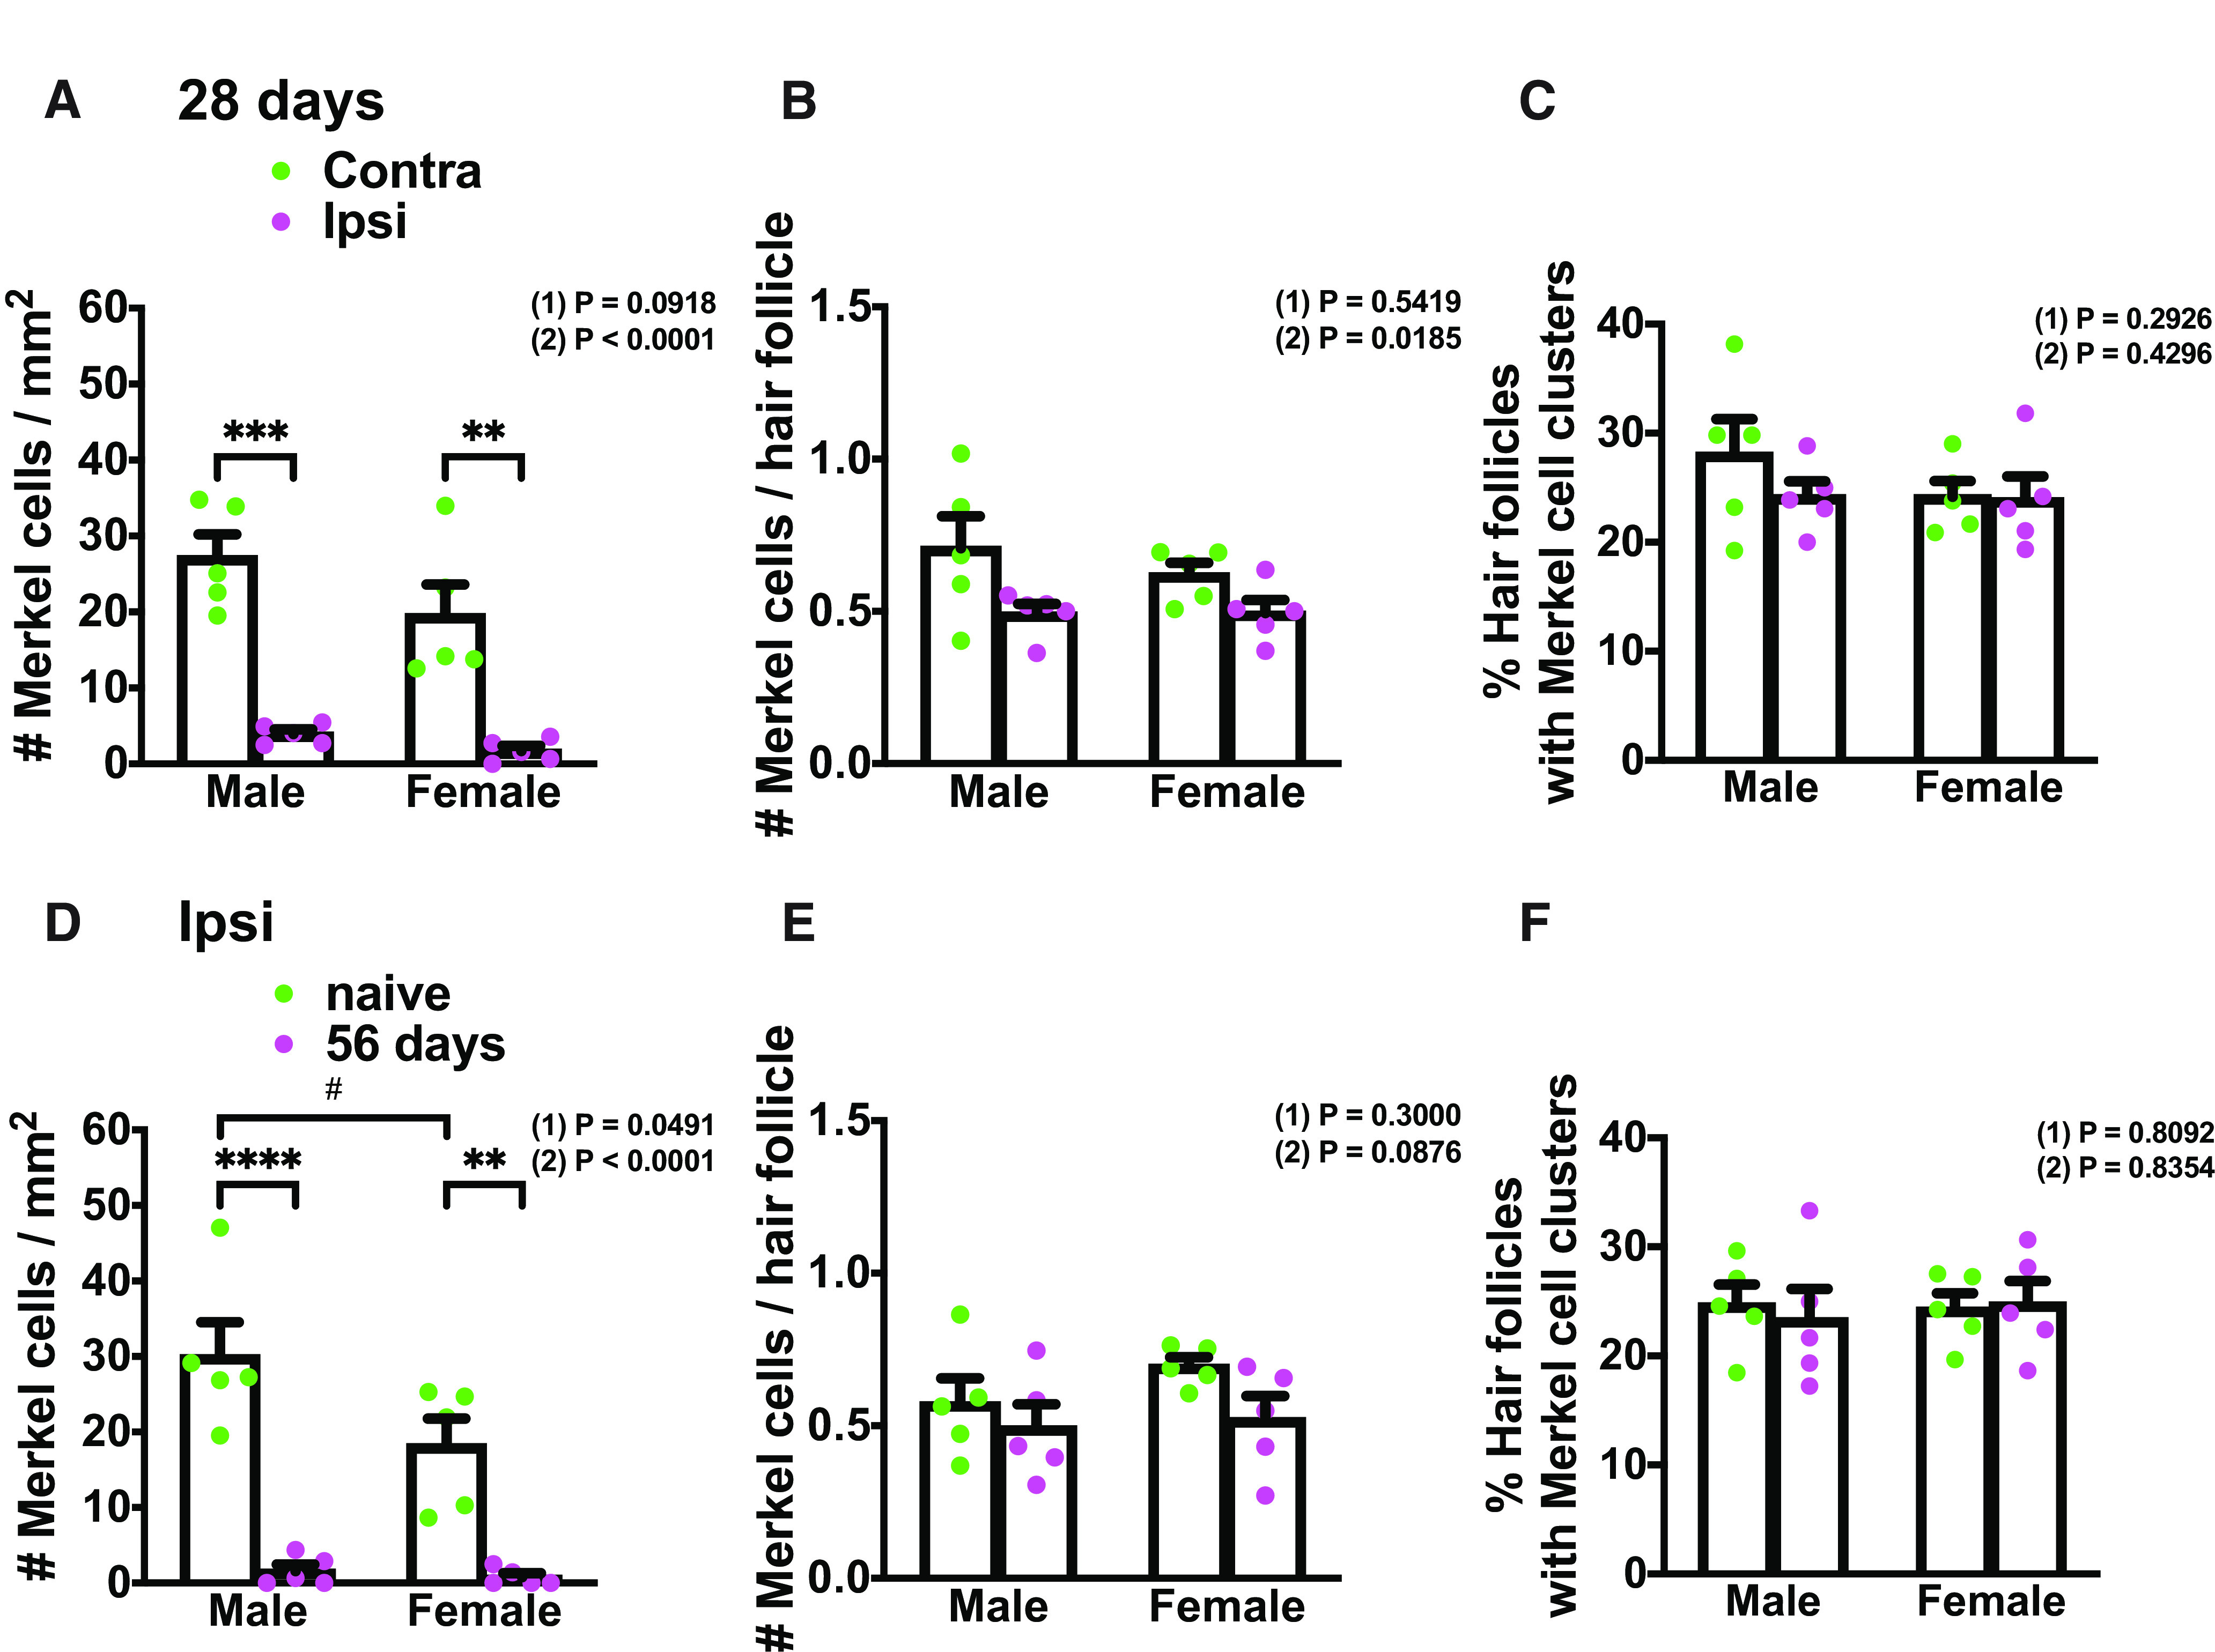
Figure 3.

Merkel cell abundance and distribution comparison in male and female mice before and after nerve injury. A, Quantification of Merkel cell density in contralateral (green) and ipsilateral (magenta) hind paw plantar skin (proximal to foot pads) in males and females at 28 d after SNI (n = 5). B, Quantification of the mean number of Merkel cells per hair follicle in the lateral hairy skin of the contralateral (green) and ipsilateral (magenta) hind paw in males and females at 28 d after SNI (n = 5). C, Quantification of the percentage of hair follicles associated with Merkel cells in the lateral hairy skin of the contralateral (green) and ipsilateral (magenta) hind paw in males and females at 28 d after SNI (n = 5). D, Quantification of Merkel cell density in naive (green) and SNI day 56 (magenta) ipsilateral hind paw plantar skin (proximal to foot pads) in males and females (n = 5). E, Quantification of the mean number of Merkel cells per hair follicle in the lateral hairy skin of the naive (green) and SNI day 56 (magenta) ipsilateral hind paw in males and females (n = 5). F, Quantification of the percentage of hair follicles associated with Merkel cells in the lateral hairy skin of the naive (green) and SNI day 56 (magenta) ipsilateral hind paw in males and females (n = 5). Data are mean ± SEM. (1) Overall p value for difference between males and females using two-way ANOVA. Results of Bonferroni post hoc correction: #p < 0.05. (2) A–C, Overall p value for difference between ipsilateral and contralateral paws using two-way ANOVA. D–F, Overall p value for difference between naive and SNI day 56 ipsilateral paws using two-way ANOVA. Results of Bonferroni post hoc correction: *p < 0.05; **p < 0.01; ***p < 0.001; ****p < 0.0001.
