Figure 1.

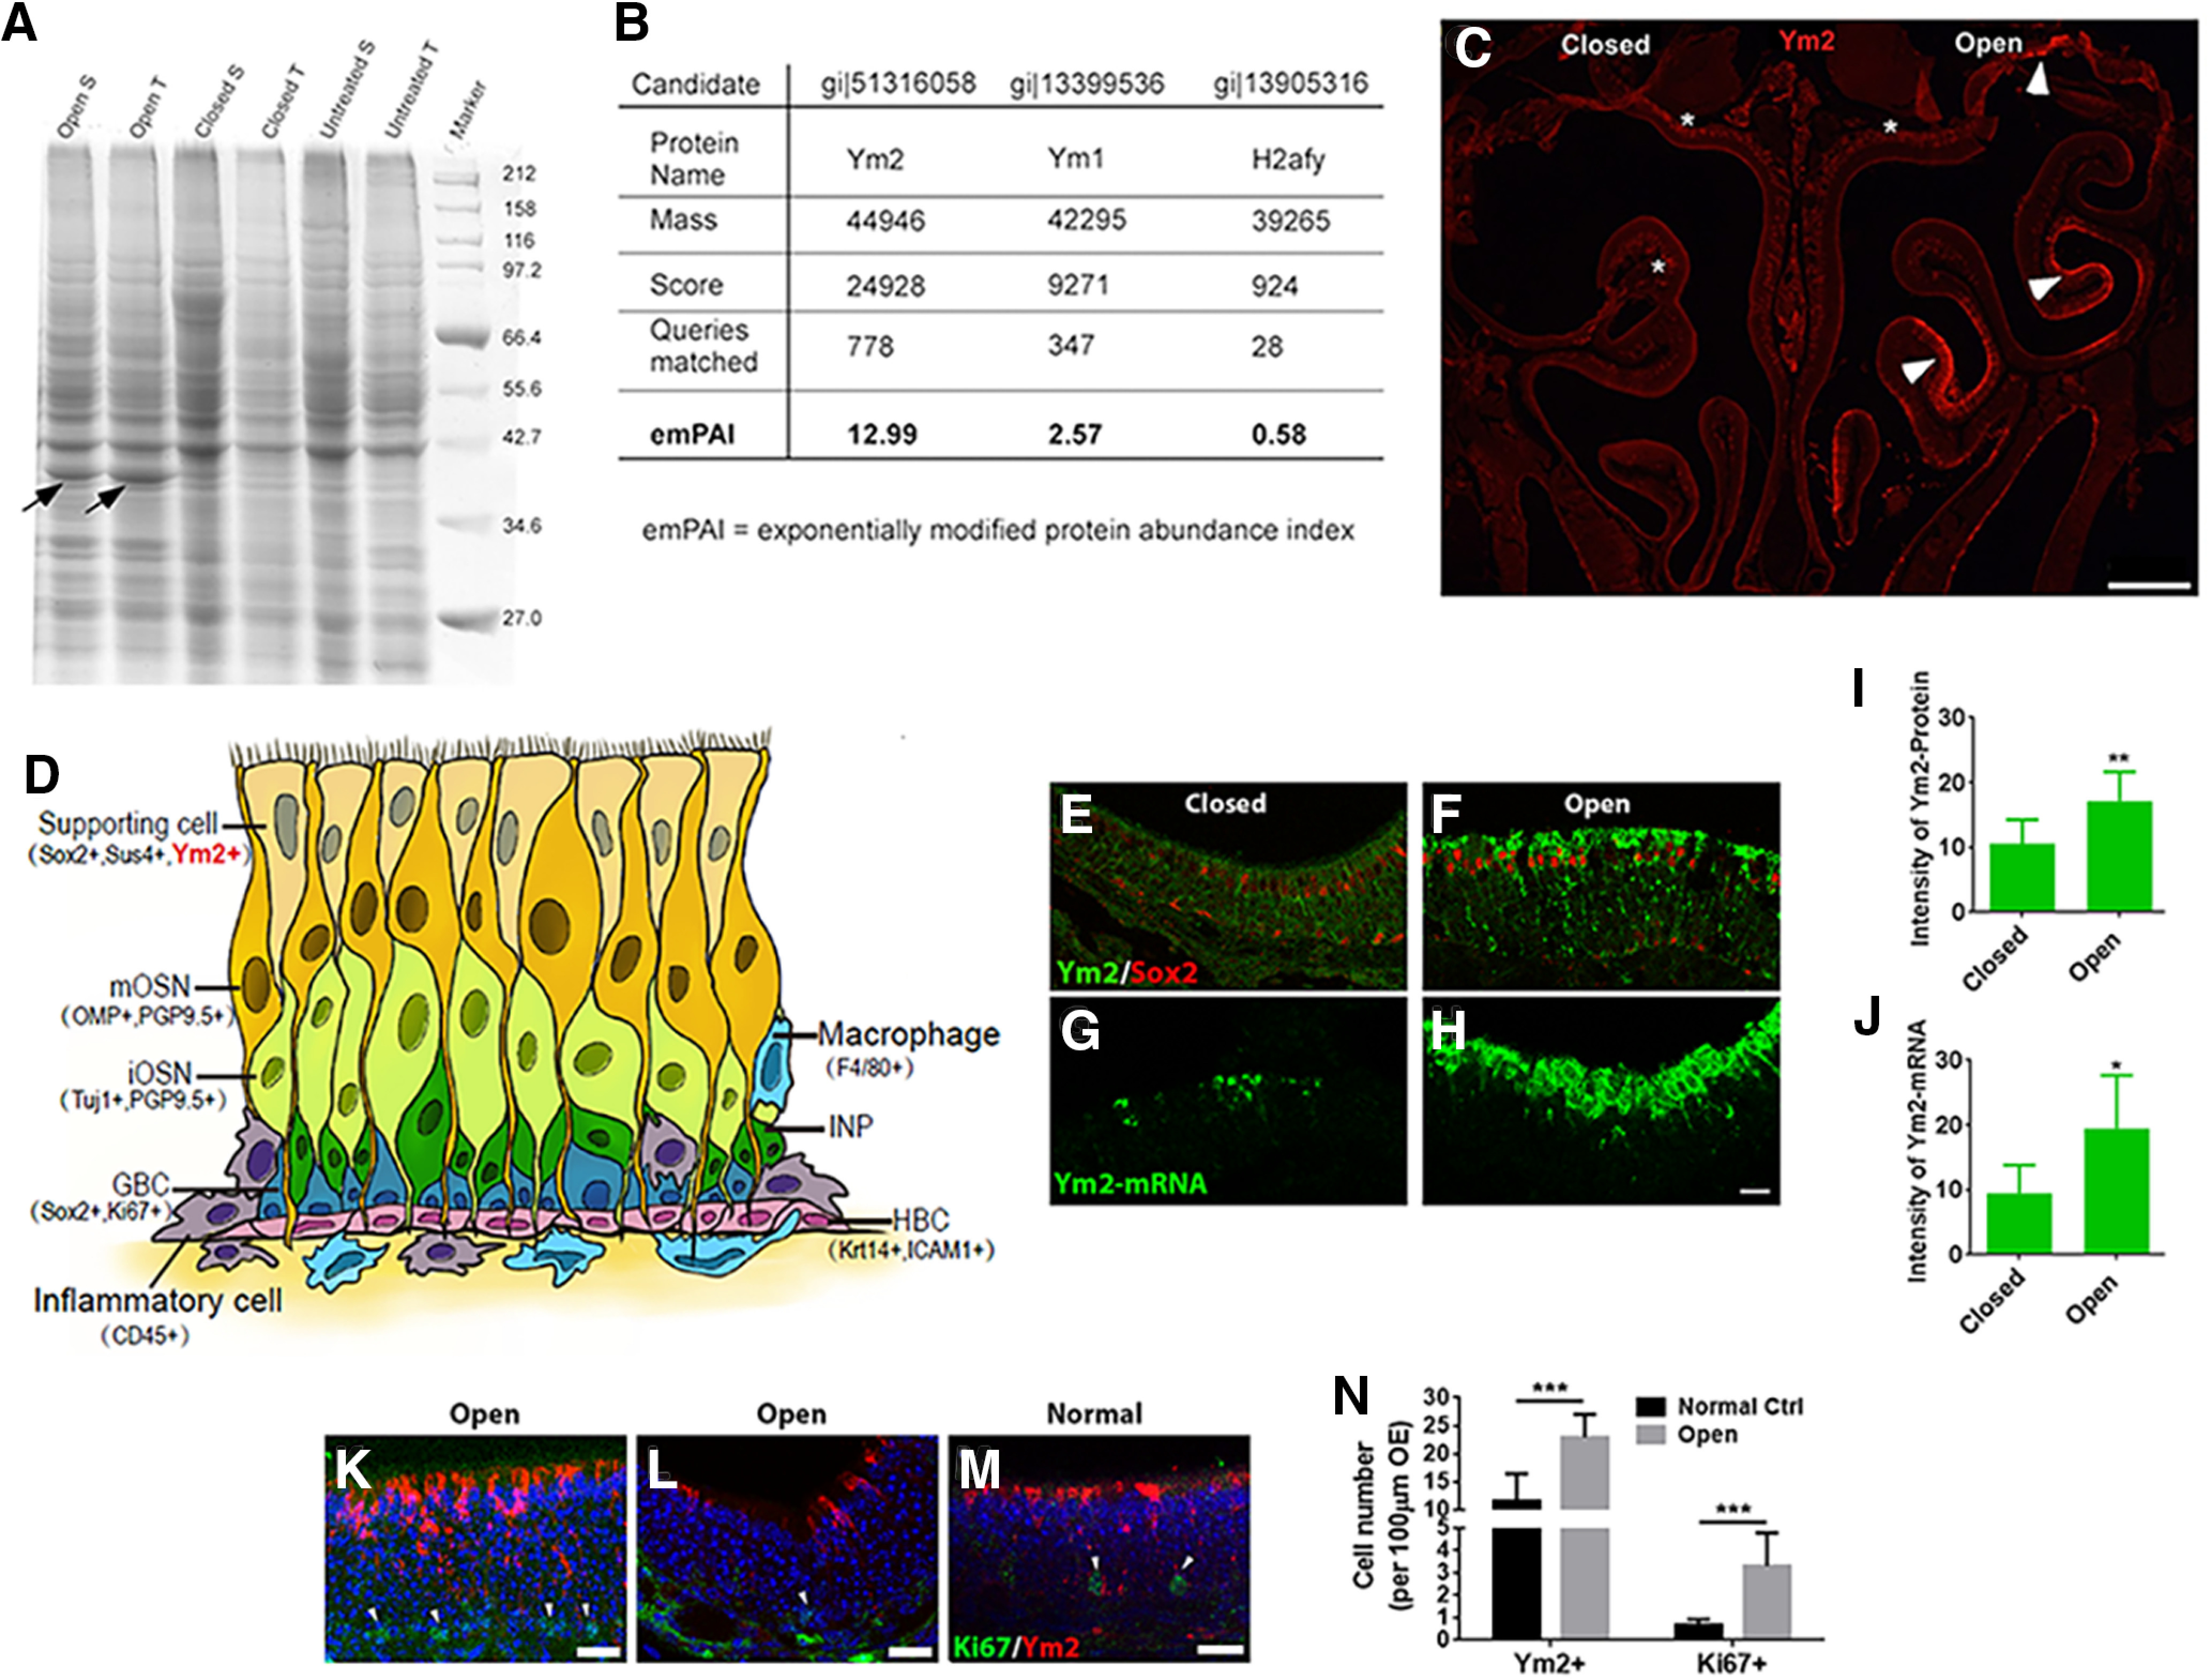
Ym2 is highly expressed on the open side of naris-occluded mice. A, Coomassie Brilliant Blue staining on an SDS-PAGE gel revealed a protein at ∼38 kDa (arrows) with the greatest difference between the closed and open sides. Tissues were collected from three mice that underwent unilateral naris closure from P1 to P30. S, Septum; T, turbinates. B, Mass spectrometric analysis revealed that the protein was most likely to be Ym2 with the highest emPAI (exponentially modified protein abundance index). Ym1 had the second highest emPAI (but much lower than Ym2), presumably because of its high sequence homology with Ym2. C, Higher Ym2 expression was observed in the open side. Arrowheads denote Ym2 antibody staining in the supporting cell layer and asterisks denote the lamina propria. D, Schematic of the OE containing multiple cell types with biomarkers in parentheses. E–H, Immunostaining and FISH indicated Ym2 was abundant in the supporting cell layer in the open side (F, H) compared with the closed side (E, G). I, J, Statistical analysis of Ym2 protein and mRNA intensity in the closed and open side (n = 9 and 10 sections, respectively, from three mice; arbitrary unit). K–M, Immunostaining against Ym2 and Ki67 in the OE of the open side of naris-occluded mice (K, L) and untreated control mice (M). Arrowheads mark Ki67+ cells. N, Statistical analysis of the number of Ym2+ and Ki67+ cells per 100 μm OE (n = 10 and 11 sections in control and open side from three mice in each condition). Because of the patchy expression of Ym2 in the open-side OE, the most densely labeled regions under the two conditions were captured and compared. Statistical significance was determined by unpaired Student's t test. I: **p = 0.009 (t(17) = 2.986); J: *p = 0.046 (t(17) = 2.524); N: ***p < 0.001; Ki67+: t(19) = 5.537; Ym2+: t(19) = 5.808. Scale bars: C, 0.5 mm; H, K–M, 20 μm.
