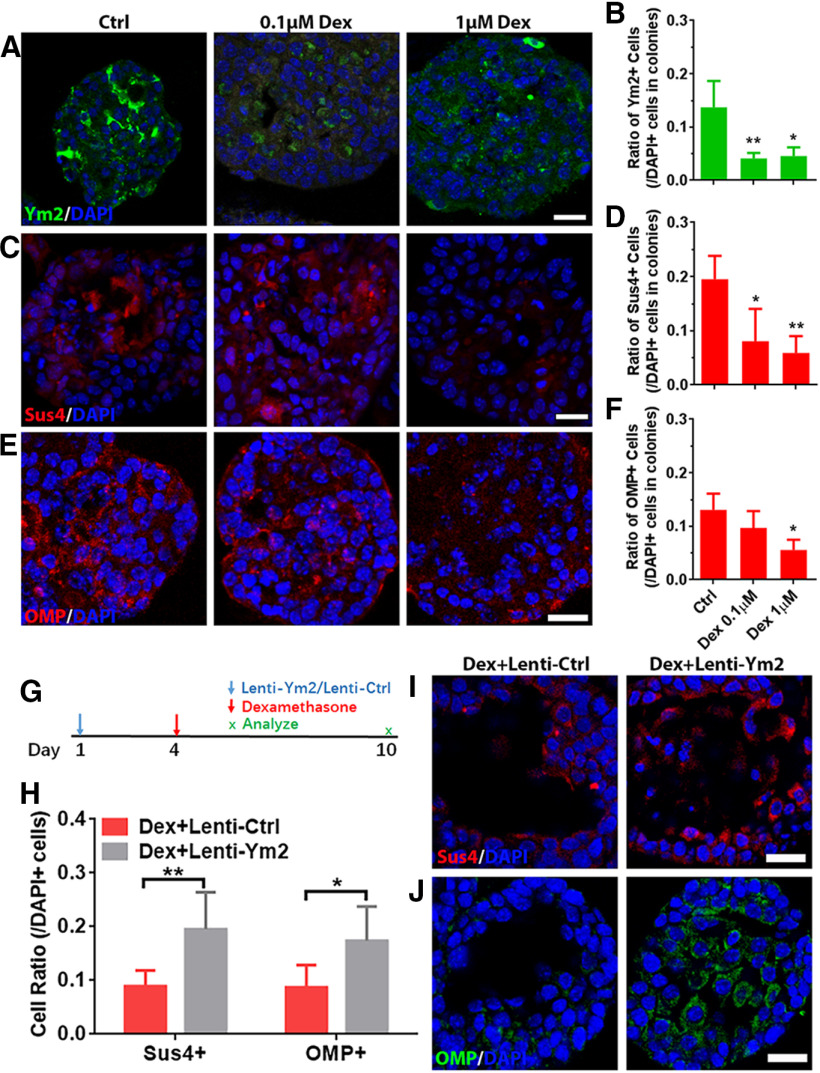
Figure 13.
Ym2 overexpression alleviates the inhibitory effect of Dex on cell differentiation of OE colonies. A, C, E, Confocal images of Ym2+, Sus4+, and OMP+ cells in saline-treated, 0.1 μm Dex-treated, or 1 μm Dex-treated OE colonies. B, D, F, Statistical analysis of the Ym2+, Sus4+, and OMP+ cell percentages in OE colonies treated with saline, 0.1 μm Dex, or 1 μm Dex (Ym2+: n = 3, 4, and 3 sections in each group; Sus4+: n = 4 sections; OMP+: n = 4, 4, and 3 sections). G, Scheme showing the Lenti-Ctrl or Lenti-Ym2 and Dex administration in OE colonies. H, Statistical analysis on the percentage of Sus4+ or OMP+ cells in Dex-treated colonies infected with Lenti-Ctrl or Lenti-Ym2 (Sus4+: n = 7 and 6 sections from three independent cultures in each group; OMP+: n = 6 sections). I, J, Confocal images of Sus4+ and OMP+ cells in Lenti-Ctrl- or Lenti-Ym2-infected colonies treated with Dex. Statistical significance was determined by one-way ANOVA with Dunnett's multiple-comparisons test (B, D, F), and by two-way ANOVA with Sidak's multiple-comparisons test (H). B: F(2,7) = 11.29, p = 0.0064; D: F(2,9) = 7.732, p = 0.0111; F: F(2,8) = 5.916, p = 0.0265; H: F(1,21) = 20.74, p = 0.0002. Scale bars, 20 μm.

