Figure 2.
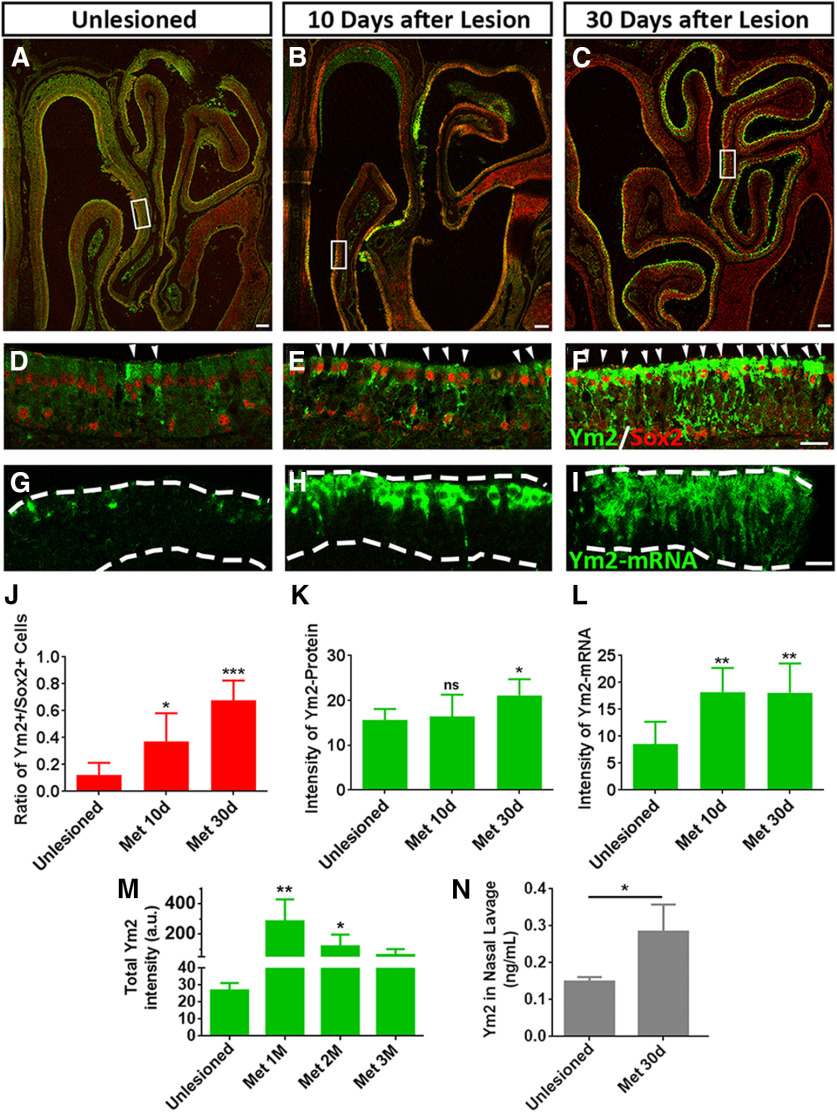
Ym2 is highly abundant in the lesioned OE. A–F, Immunostaining revealed that Ym2 protein was upregulated in methimazole-lesioned OE on day 10 (B, E) and day 30 (C, F) compared with the unlesioned OE (saline injection; A, D). G–I, FISH analysis revealed higher Ym2-mRNA expression in the lesioned OE on day 10 (H) and day 30 (I) compared with the unlesioned control (G). J–L, Statistical analysis of the percentage of Ym2+/Sox2+ cells (J; n = 4, 10, and 9 sections from three mice in each group), immunostaining signal intensity (K; n = 5, 10, and 14 sections), and FISH signal intensity (L; n = 6, 12, and 20 sections). M, Statistical analysis of the total intensity of immunostaining against Ym2 in unlesioned and lesioned OE (months 1, 2, and 3 postinjury; n = 5, 6, 6, and 5 sections from three mice in each group). a.u., arbitrary unit. N, Concentration of Ym2 in the nasal lavage from methimazole-treated (30 d postinjection) and age-matched unlesioned mice (n = 3 mice in each condition). Statistical significance was determined by one-way ANOVA with Dunnett's multiple-comparisons test (J–M) and by unpaired t test (N). ns, Not significant. J: F(2,20) = 16.21, p < 0.0001; K: F(2,26) = 5.764, p = 0.0085; L: F(2,35) = 4.902, p = 0.0133; M: F(3,18) = 8.456, p = 0.0016; N: *p = 0.022 (t(4) = 2.268). Asterisks indicated the significance when compared with the unlesioned group. The rectangles in A–C are enlarged in D–F. Arrowheads in D–F point to Sox2+/Ym2+ cells. The unit of Ym2-protein and Ym2-mRNA intensity in K, L, and M is arbitrary. The dashed lines in G–I mark the OE borders. Met, methimazole. Scale bars: A–C, 100 μm; F, I, 20 μm.

