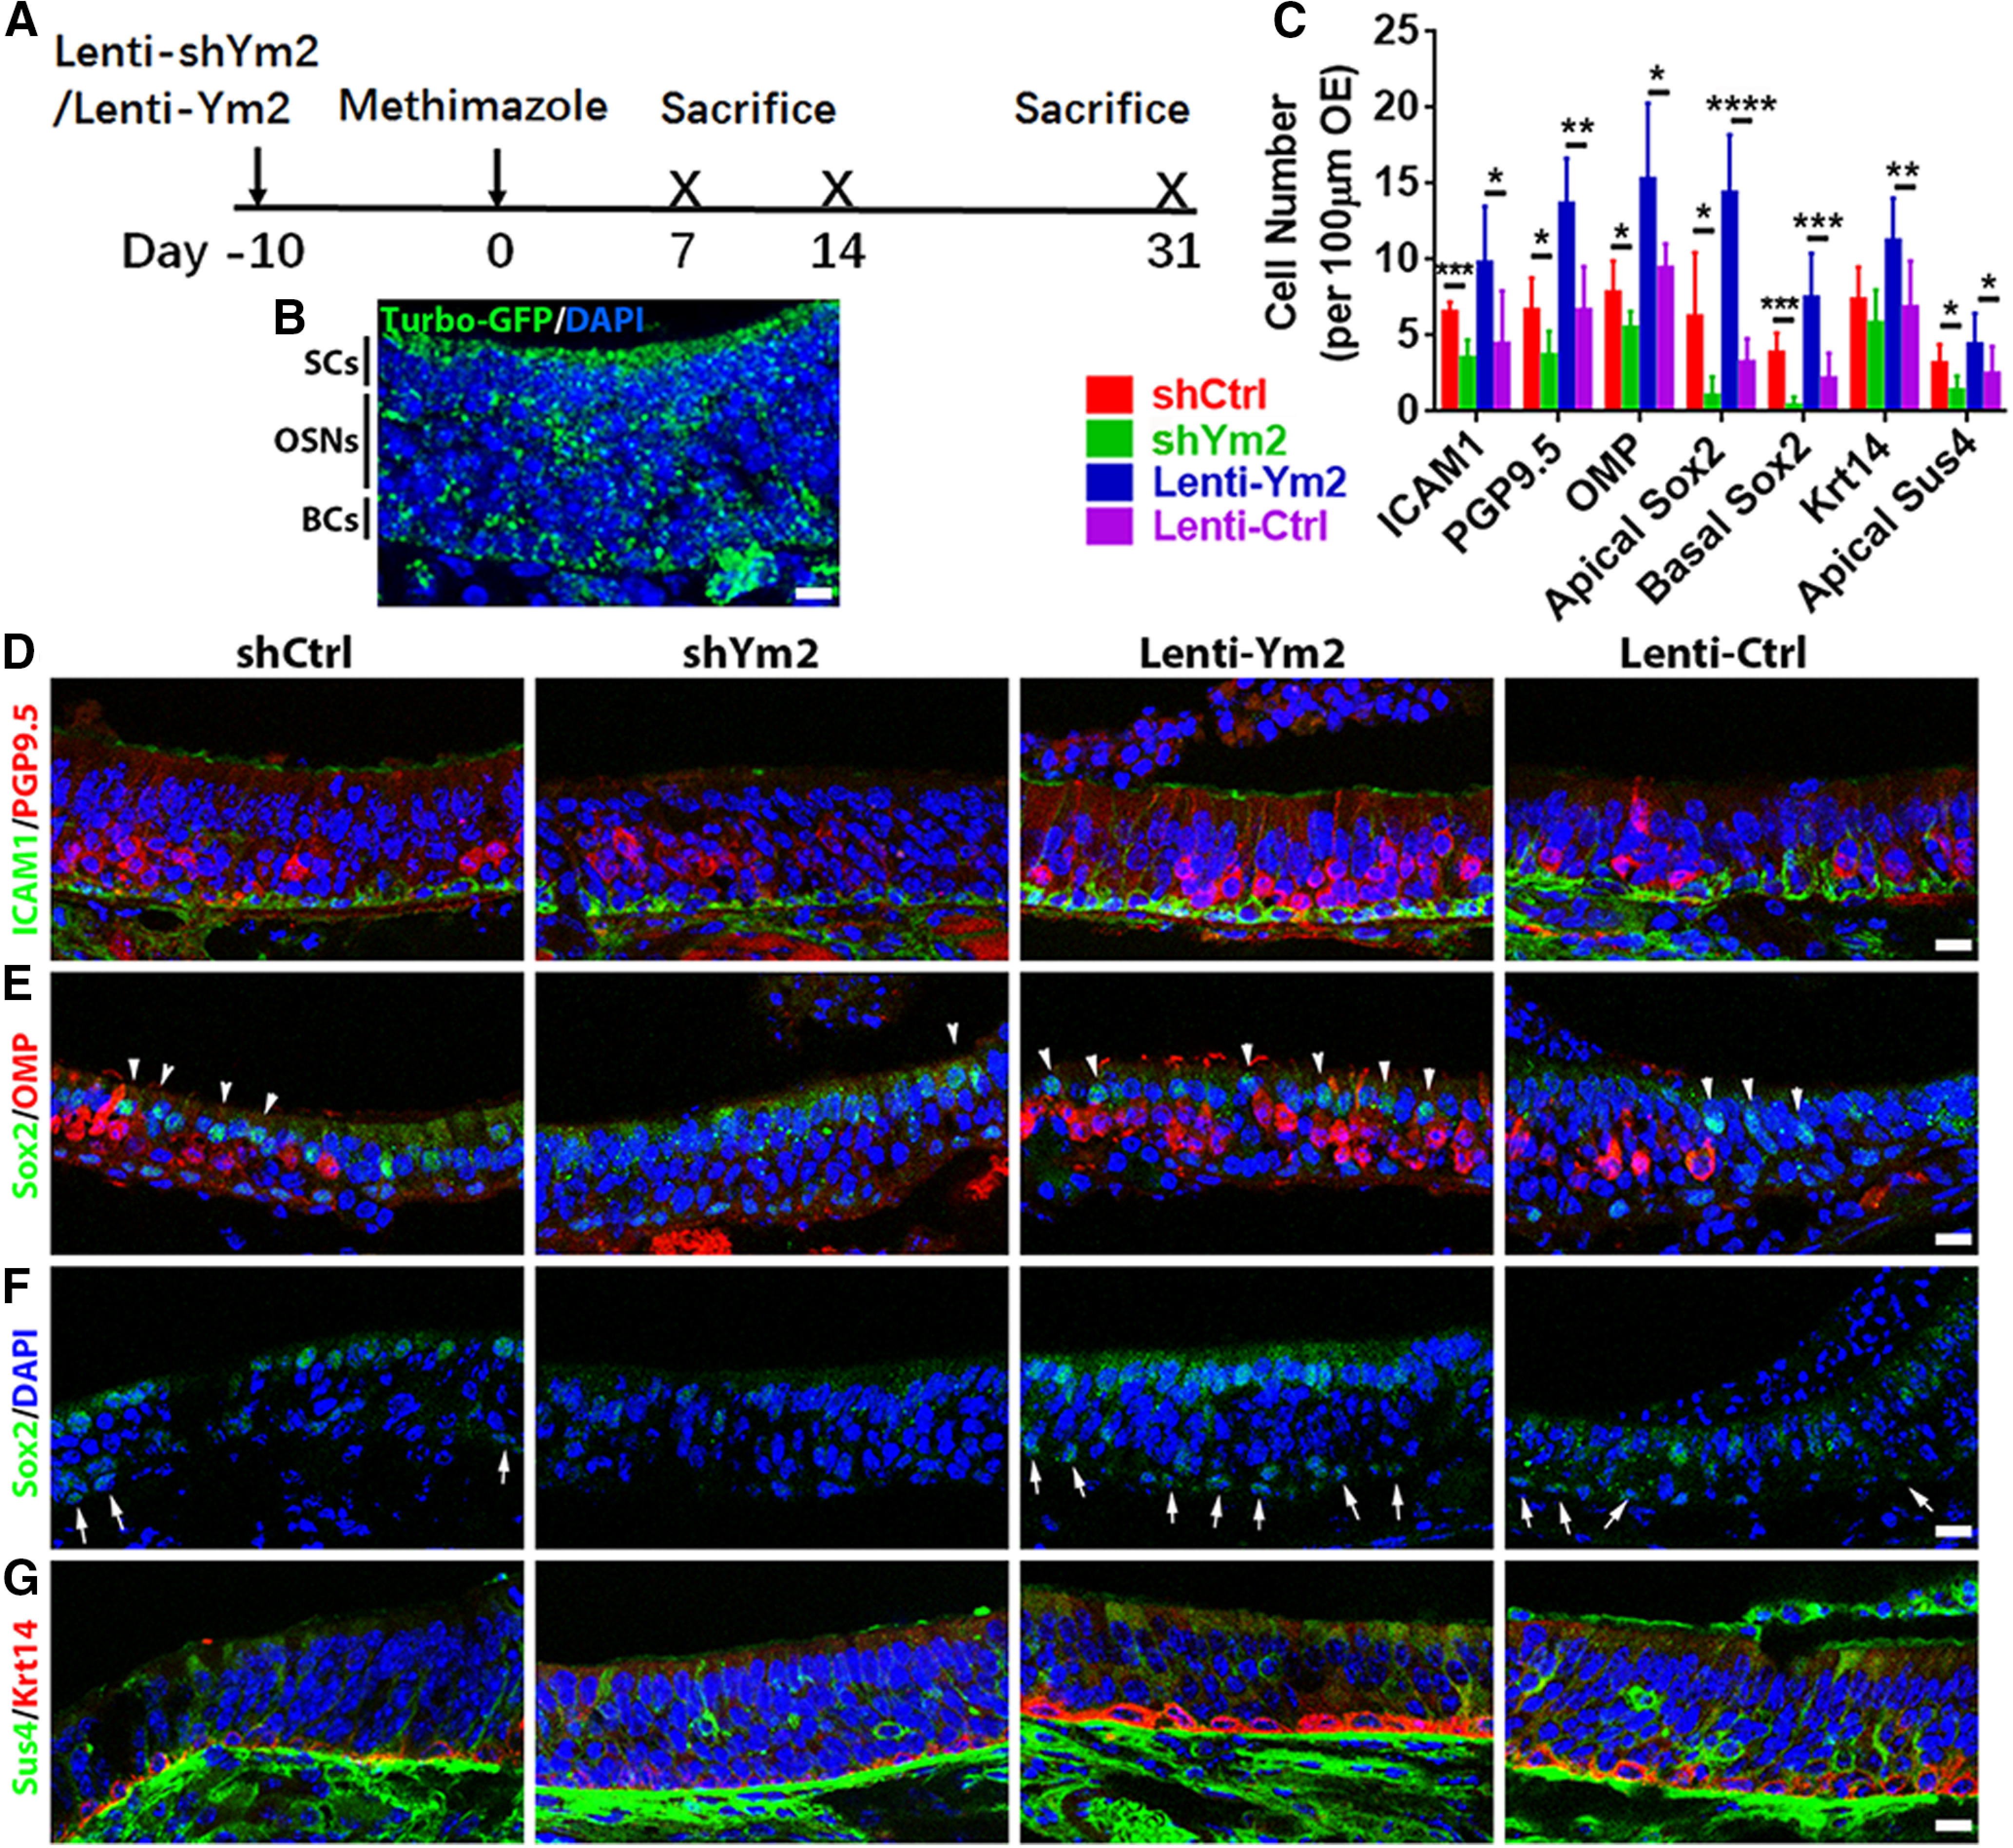
Figure 5.

Ym2 regulates the recovery of the lesioned OE. A, The timeline of lentiviral and methimazole administration. B, Confocal image of Lenti-shYm2-infected OE immunostained with anti-TurboGFP. C, Statistical analysis of ICAM1+, PGP9.5+, OMP+, apical Sox2+, basal Sox2+, Krt14+, and Sus4+ cells/100 µm OE in Lenti-shCtrl, Lenti-shYm2, Lenti-Ym2, and Lenti-Ctrl groups on day 14 postlesion (n = 9 sections from three mice in each group). D–G, Confocal images of ICAM1+ and PGP9.5+ (D), apical Sox2+ and OMP+ (E), basal Sox2+ (F), and Sus4+ and Krt14+ (G) cells in the OE on day 14 post-OE lesion from mice injected with Lenti-shCtrl, Lenti-shYm2, Lenti-Ym2, or Lenti-Ctrl. Apical and basal Sox2+ cells are denoted by arrowheads and arrows in E and F. Statistical significance was determined by unpaired Student's t test. ICAM1+: ***p = 0.0003 (t = 5.47) and *p = 0.022 (t = 2.664); PGP9.5+: *p = 0.018 (t = 2.769) and **p = 0.0013 (t = 4.261); OMP+: *p = 0.041 (t = 2.372) and *p = 0.027 (t = 2.781); apical Sox2+: *p = 0.028 (t = 2.605) and ****p < 0.0001 (t = 7.109); basal Sox2+: ***p = 0.0002 (t = 5.55) and ***p = 0.0003 (t = 4.631); Krt14+: p = 0.237 (t = 1.251) and **p = 0.008 (t = 3.05); apical Sus4+: *p = 0.02 (t = 2.742) and *p = 0.023 (t = 2.065). The degree of freedom for all t tests is 16. Scale bars, 10 μm.
