Figure 9.

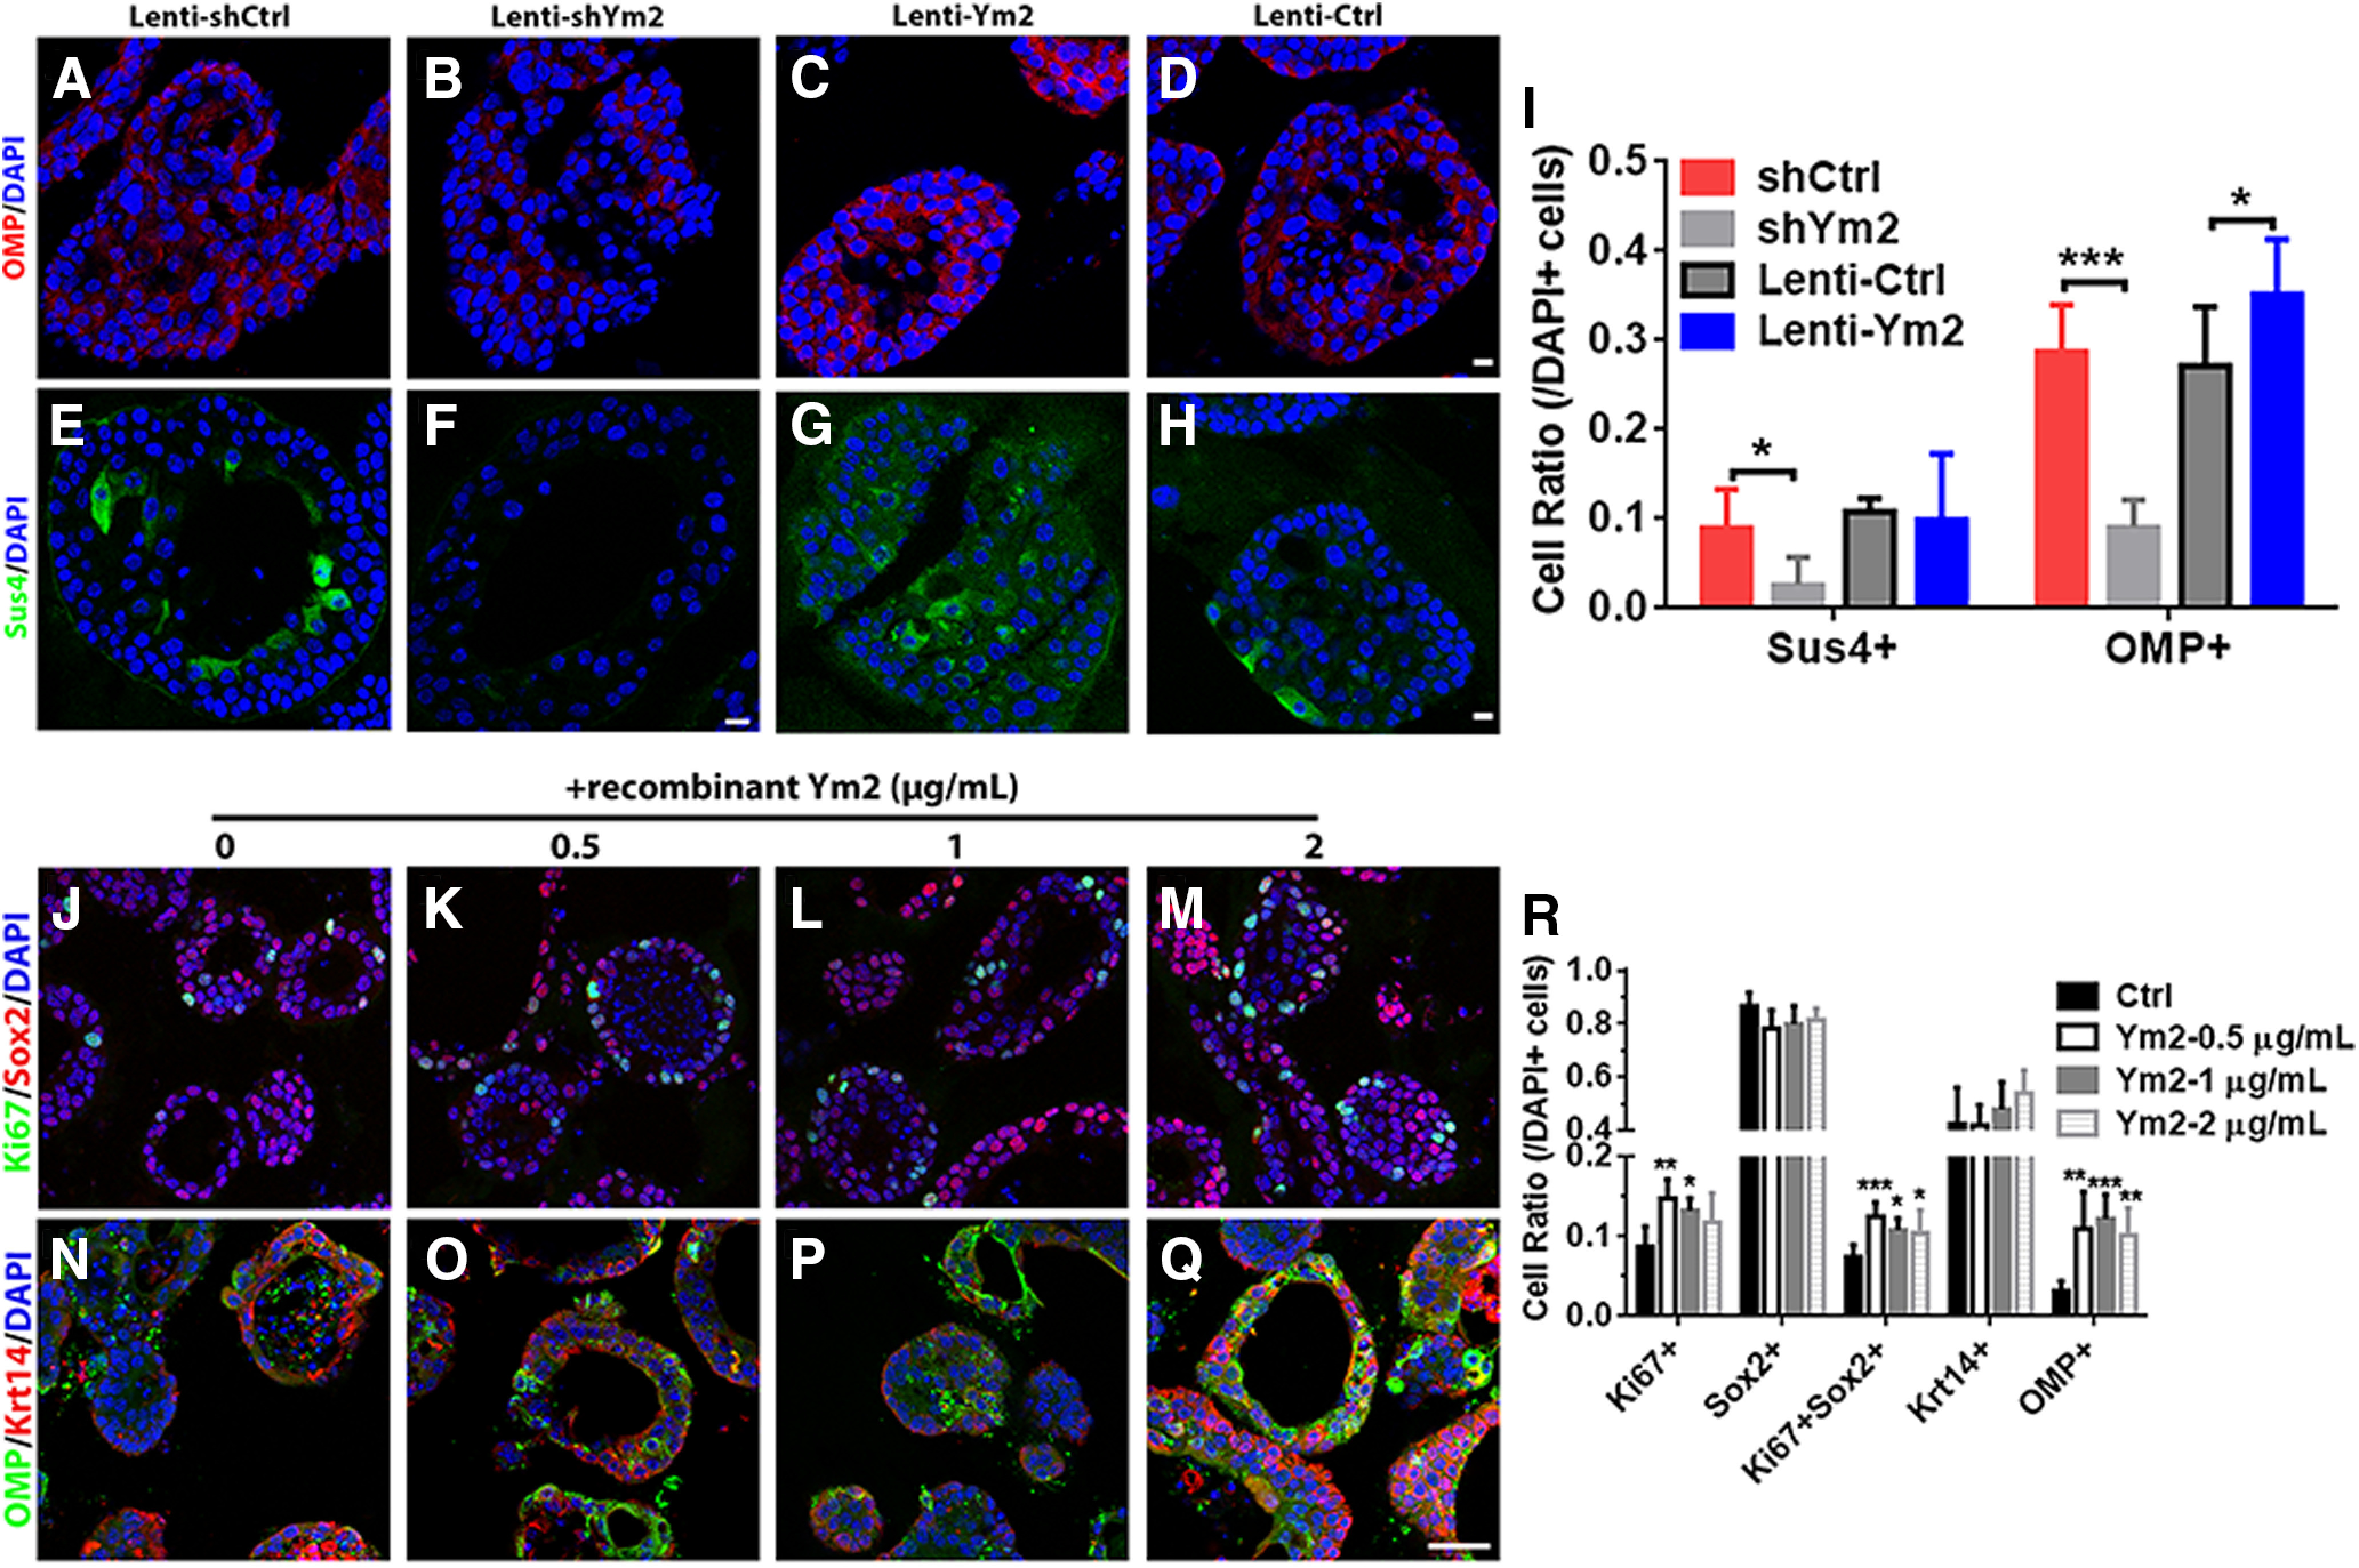
Ym2 regulates cell differentiation in OE colonies. A–D, Confocal images of OMP+ cells in colonies infected with Lenti-shCtrl, Lenti-shYm2, Lenti-Ctrl, or Lenti-Ym2. E–H, Immunostaining against Sus4 in Lenti-shCtrl-, Lenti-shYm2-, Lenti-Ctrl-, or Lenti-Ym2-infected colonies. I, Statistical analysis of Sus4+ and OMP+ cell ratios in colonies with Lenti-shCtrl, Lenti-shYm2, Lenti-Ctrl, or Lenti-Ym2 infection (Sus4+: n = 7, 6, 7, and 6 sections from three independent cultures in each group; OMP: n = 6 sections in each group). J–M, Confocal images of Sox2+ and Ki67+ cells in OE colonies treated with 0, 0.5, 1, and 2 μg/ml Ym2. N–Q, Confocal images of OMP+ and Krt14+ cells in OE colonies treated with 0, 0.5, 1, and 2 μg/ml Ym2. R, Statistical analysis of Ki67+, Sox2+, Ki67+Sox2+, Krt14+, and OMP+ cells in untreated and recombinant Ym2-treated colonies (Ki67+, Sox2+, Ki67+Sox2+: n = 6 sections from three independent cultures in each group; Krt14+, OMP+: n = 5 sections in Ctrl and 0.5 μg/ml Ym2-treated groups; n = 6 sections in 1 and 2 μg/ml Ym2-treated groups). Statistical significance in I was determined by two-way ANOVA: F(3,42) = 26.05, p < 0.0001. Asterisks in I were determined by Sidak's multiple-comparisons test. Statistical significance in R was determined by one-way ANOVA, and asterisks were measured by Dunnett's multiple comparisons test. Ki67+: F(3,20) = 5.691, p = 0.0055; Sox2+: F(3,20) = 2.389, p = 0.0991; Ki67+Sox2+: F(3,20) = 6.707, p = 0.0026; Krt14+: F(3,18) = 1.696, p = 0.2036; OMP+: F(3,18) = 7.838, p = 0.0015. Scale bars, 10 μm.
