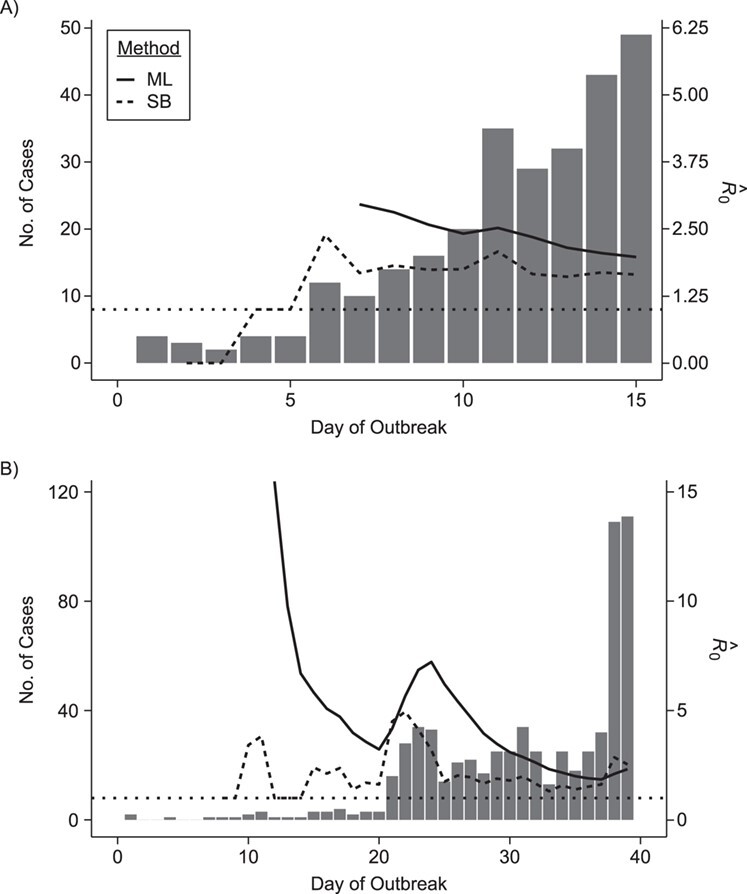
Figure 1.

Estimates of the basic reproductive number  derived using data cumulatively collected during the exponential growth phase of the outbreaks for the 2009 H1N1 influenza pandemic (A) and the 2003 severe acute respiratory syndrome outbreak (B). The sequential Bayes (SB) and White and Pagano maximum likelihood (ML) estimators are shown. Estimates for each day depict the estimate of
  obtained using data available at that point. The horizontal dotted line is positioned at the critical value of 1 for
  .
.
