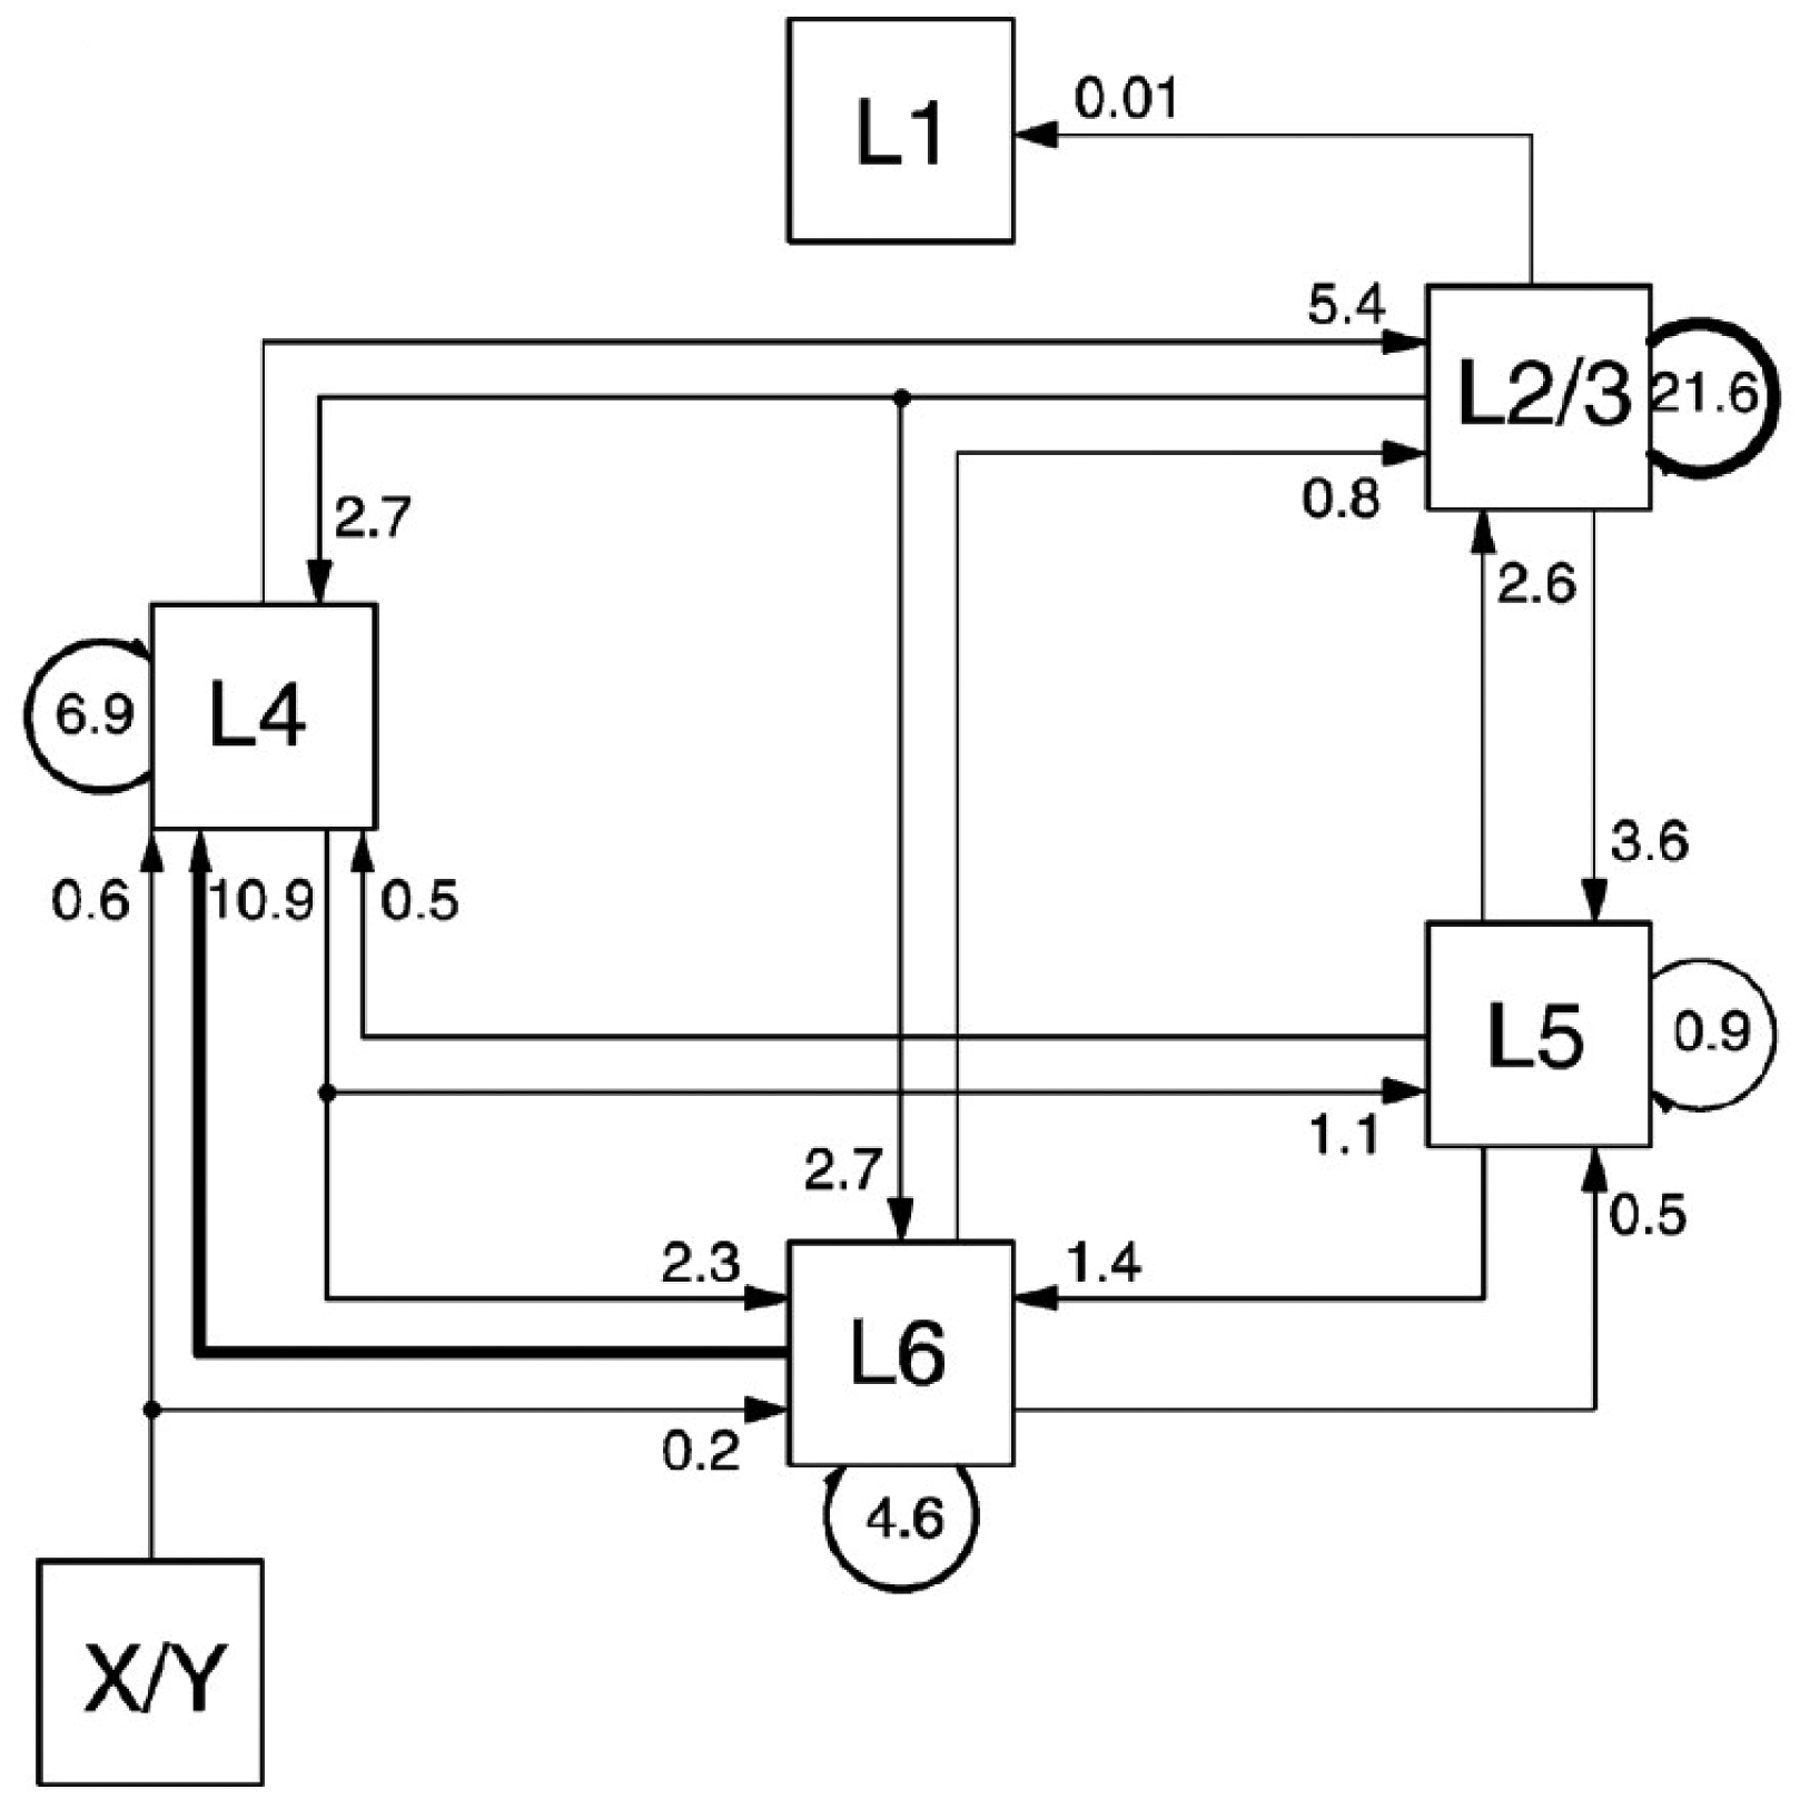
Figure 1. Quantitative map of excitatory synapses between excitatory neurons of the local microcircuit in visual cortex (area 17) of the cat.

Numbers indicate proportions of excitatory synapses, note the dominance of within layer recurrent connectivity with 21.6 peak values in Layers 2/3. The FF loop starts in layer 4, the major thalamic recipient layer and then extends to layers 2/3, 5 and 6 with recurrent inputs back to layer 4. This FF loop corresponds to a little less than half of synapses involved in self-innervation of individual cortical layers. X/Y refers to the component cells of the lateral geniculate nucleus, the major thalamic relay. The original canonical microcircuit is shown in Figure 9B. L refers to layer. From (Binzegger et al., 2004) with permission.
