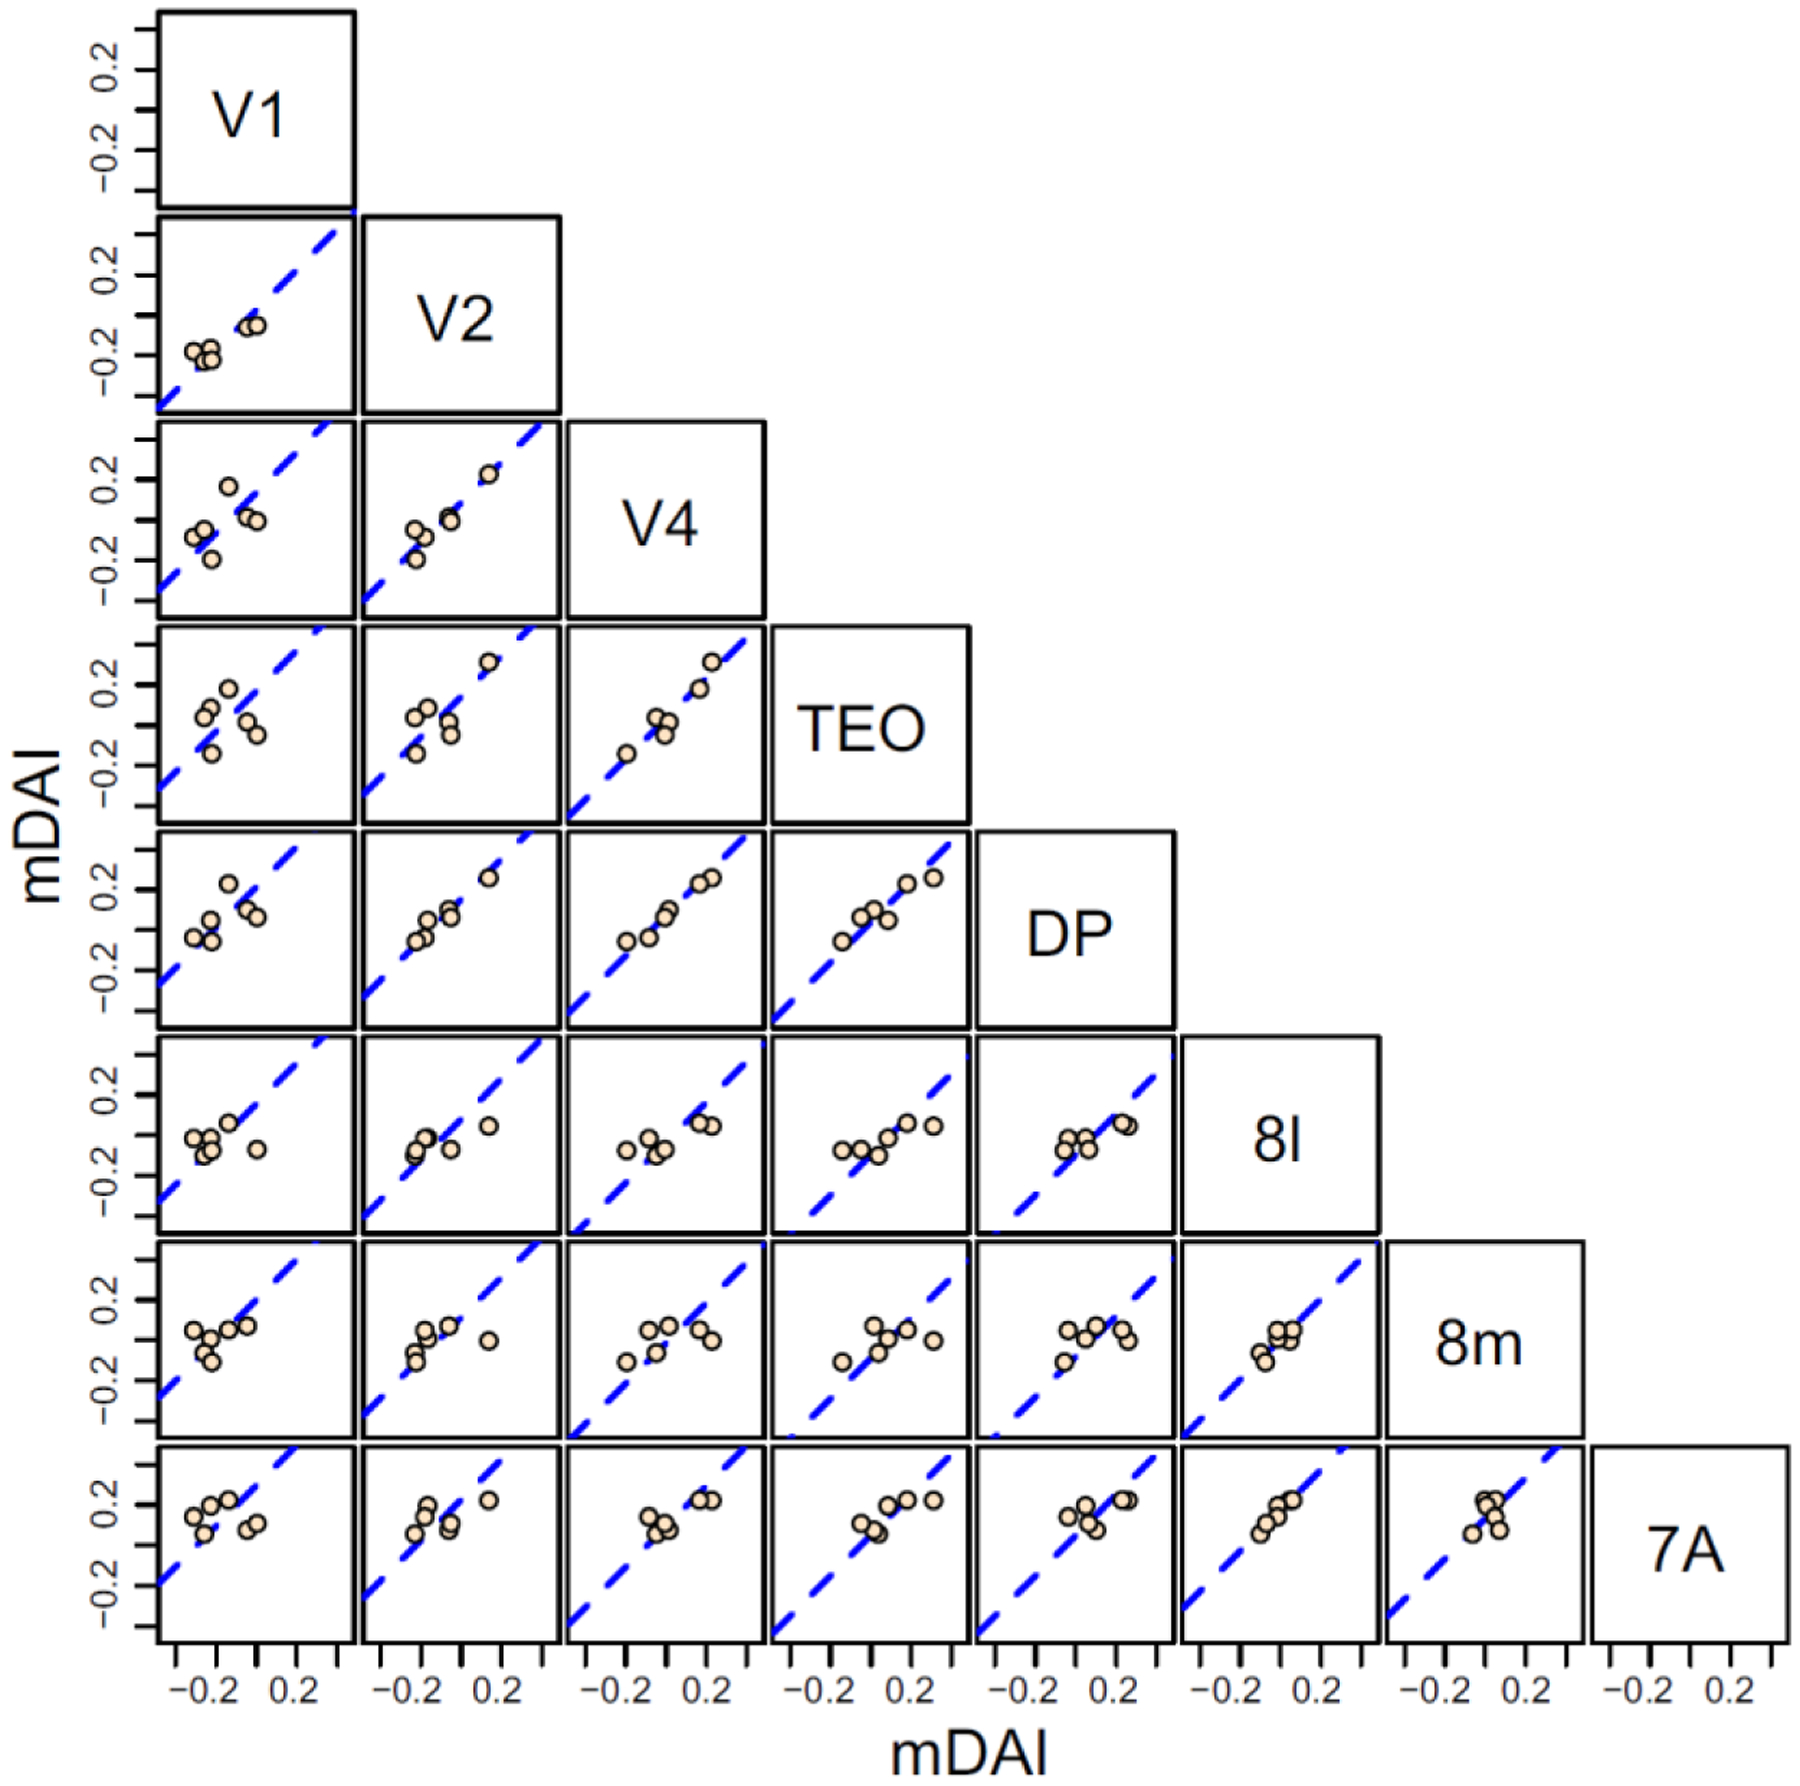
Figure 13.

Scatter plots of a hierarchical measure of cortical distance (mDAI) derived by Bastos et al., 2015 of common source areas for pairs of 8 visual areas obtained from contrasting Granger Causality measures in gamma, theta and beta bands. The abscissa of each graph corresponds to the value calculated for the area at the top of the column and the ordinate to the area at the right of the row. Dashed blue line in each plot is the best fit line of unit slope.
