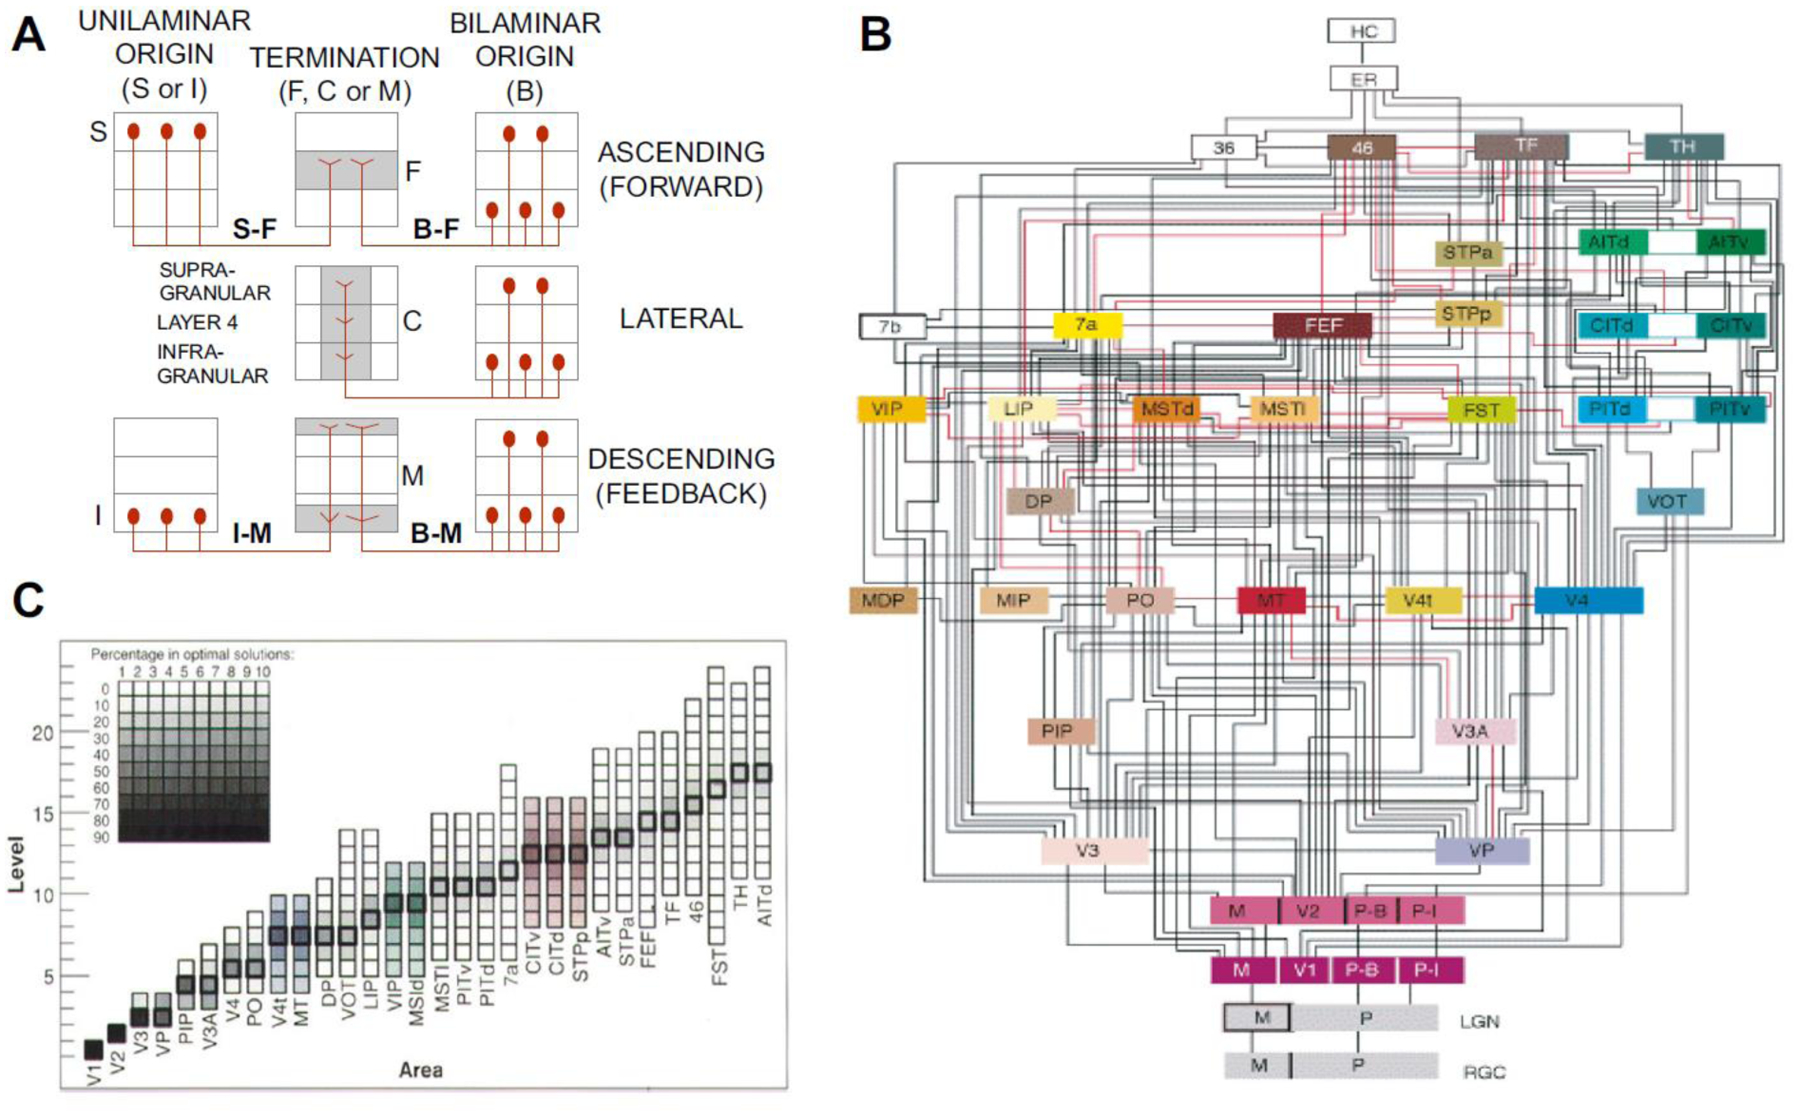
Figure 2. The Felleman and Van Essen binary model of cortical hierarchy.

A) Criteria for classifying connections between areas as FF (top), lateral (middle) and FB (bottom) row. Termination patterns are depicted in the central column, preferentially in layer 4 (F pattern) FF, across all layers (C pattern) lateral, in upper and lower layers avoiding layer 4 (M pattern) FB. Laminar origin from a single layer (left column), is either supragranular (S) and therefore FF, or infragranular (I) and therefore FB. Bilaminar (B) origins (right column) either terminate in the middle layers (F pattern) and are therefore FF, terminate in all layers (lateral) or terminate predominantly in upper supra- and infragranular layers (M pattern) and therefore FB. B) The binary hierarchical model. C: Area frequency distributions for 150,000 optimal hierarchical orderings (Hilgetag et al., 1996).
