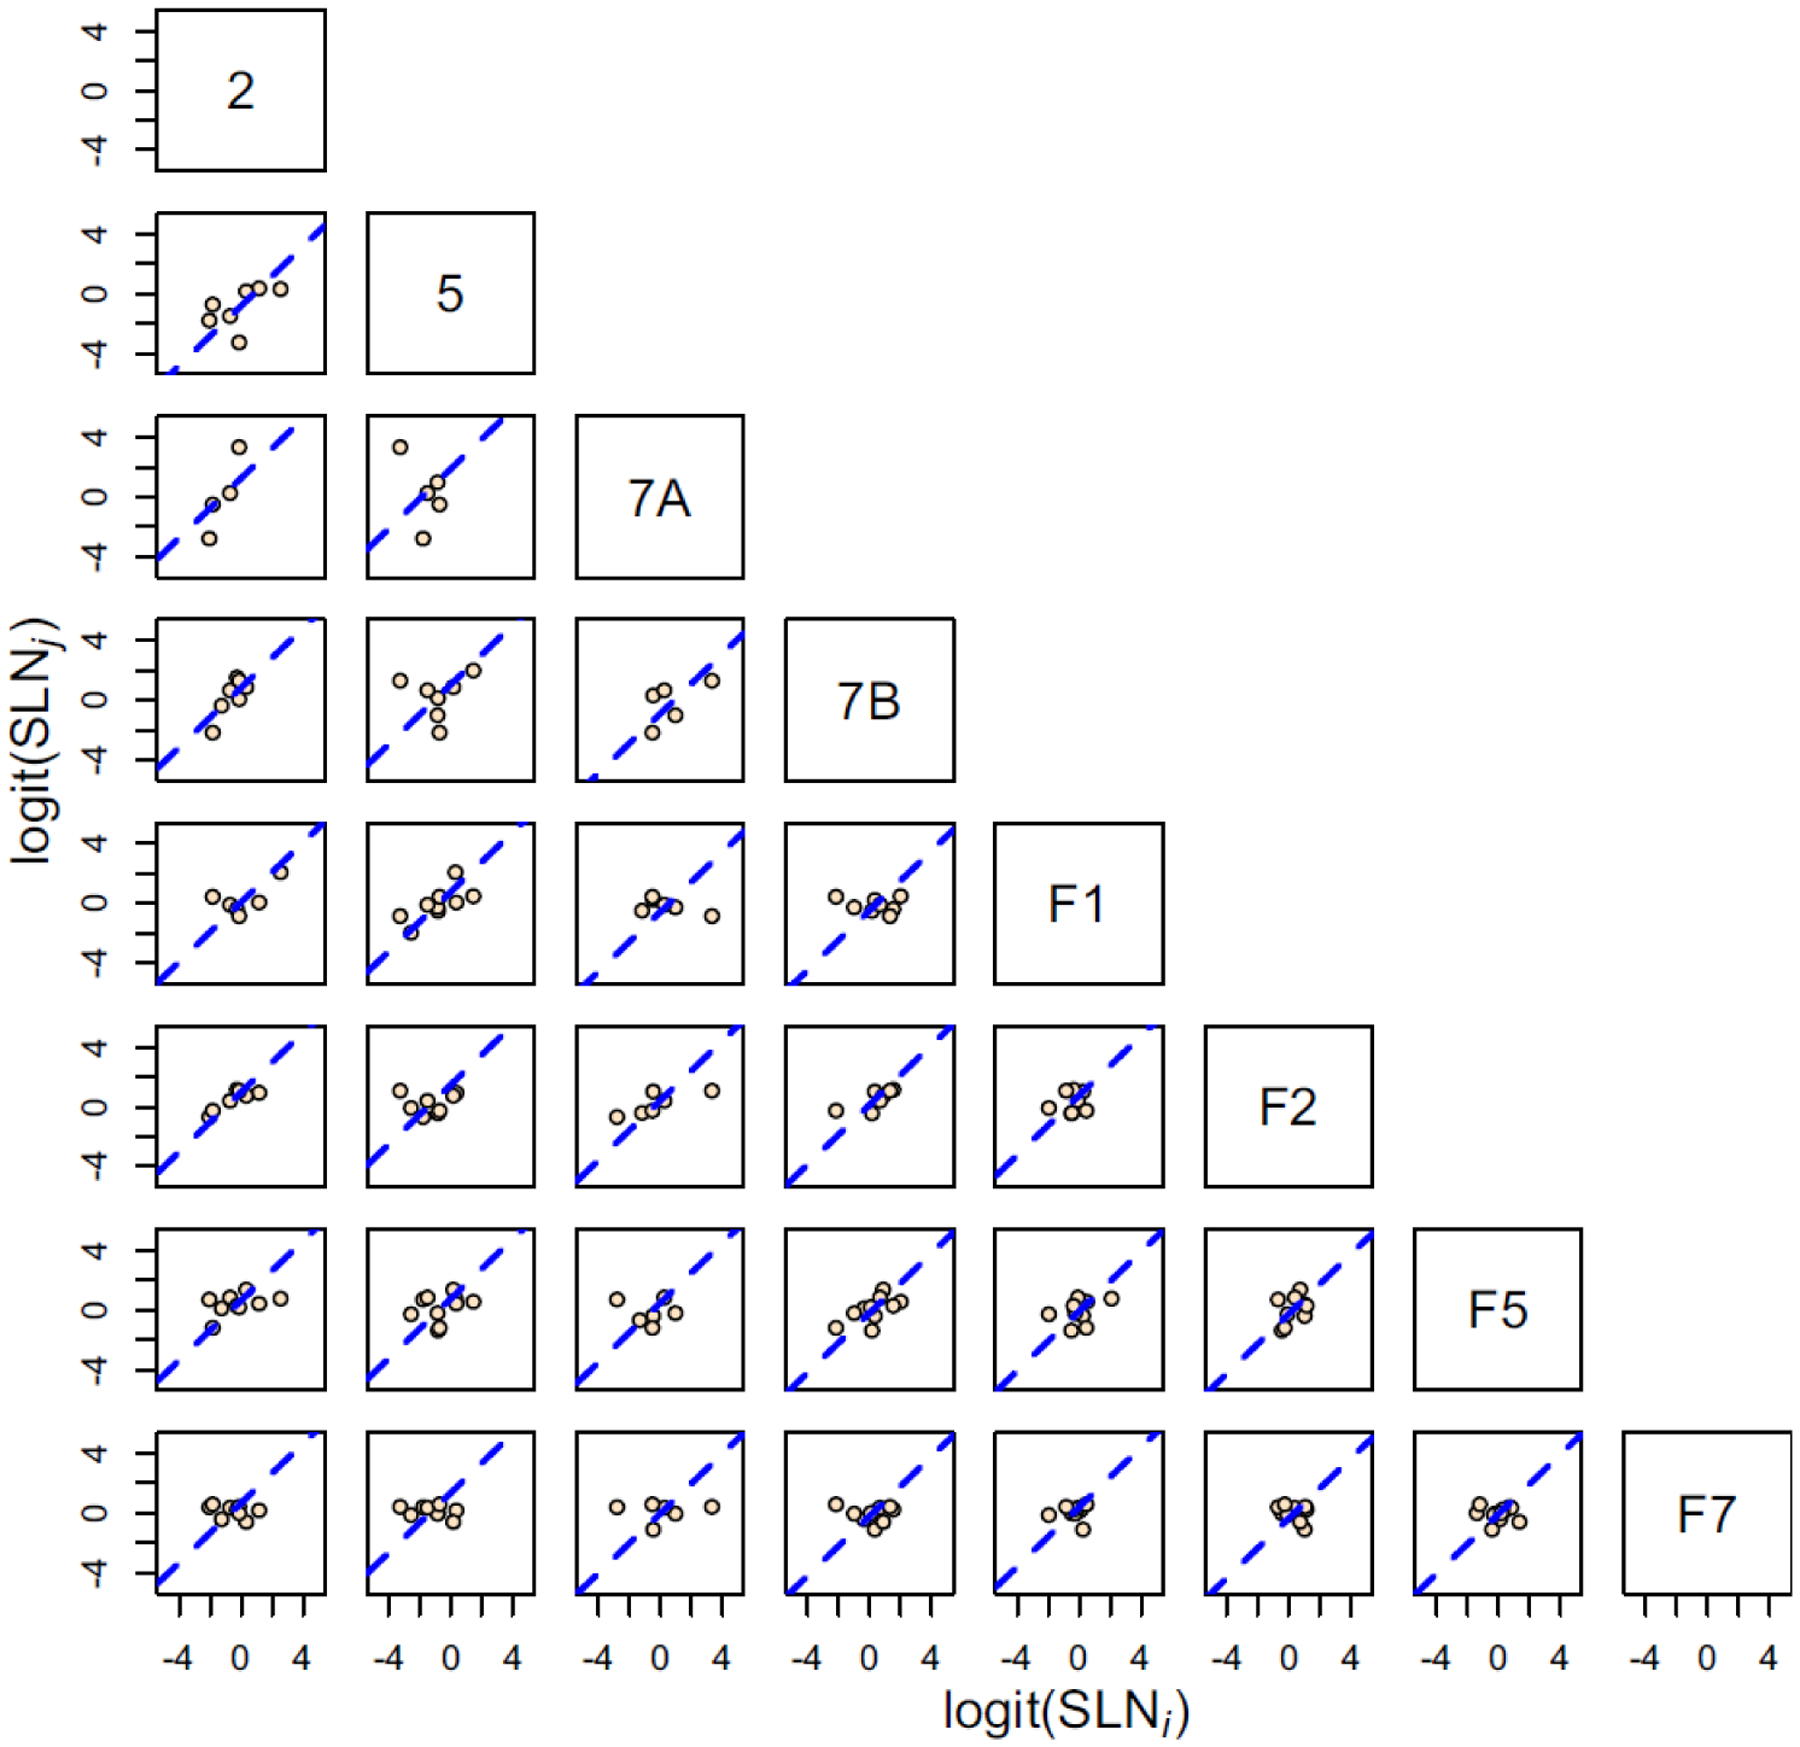
Figure 6. Logit transformation.

Scatter plots of logit transformed SLN values of common source areas from pairs of 8 somatosensory and motor areas, obtained from retrograde tracer injections. The plots follow the same format as in Figure 6 except that the SLN values from each axis are transformed by the logit function. The dashed blue line in each plot is the best fit line of unit slope.
