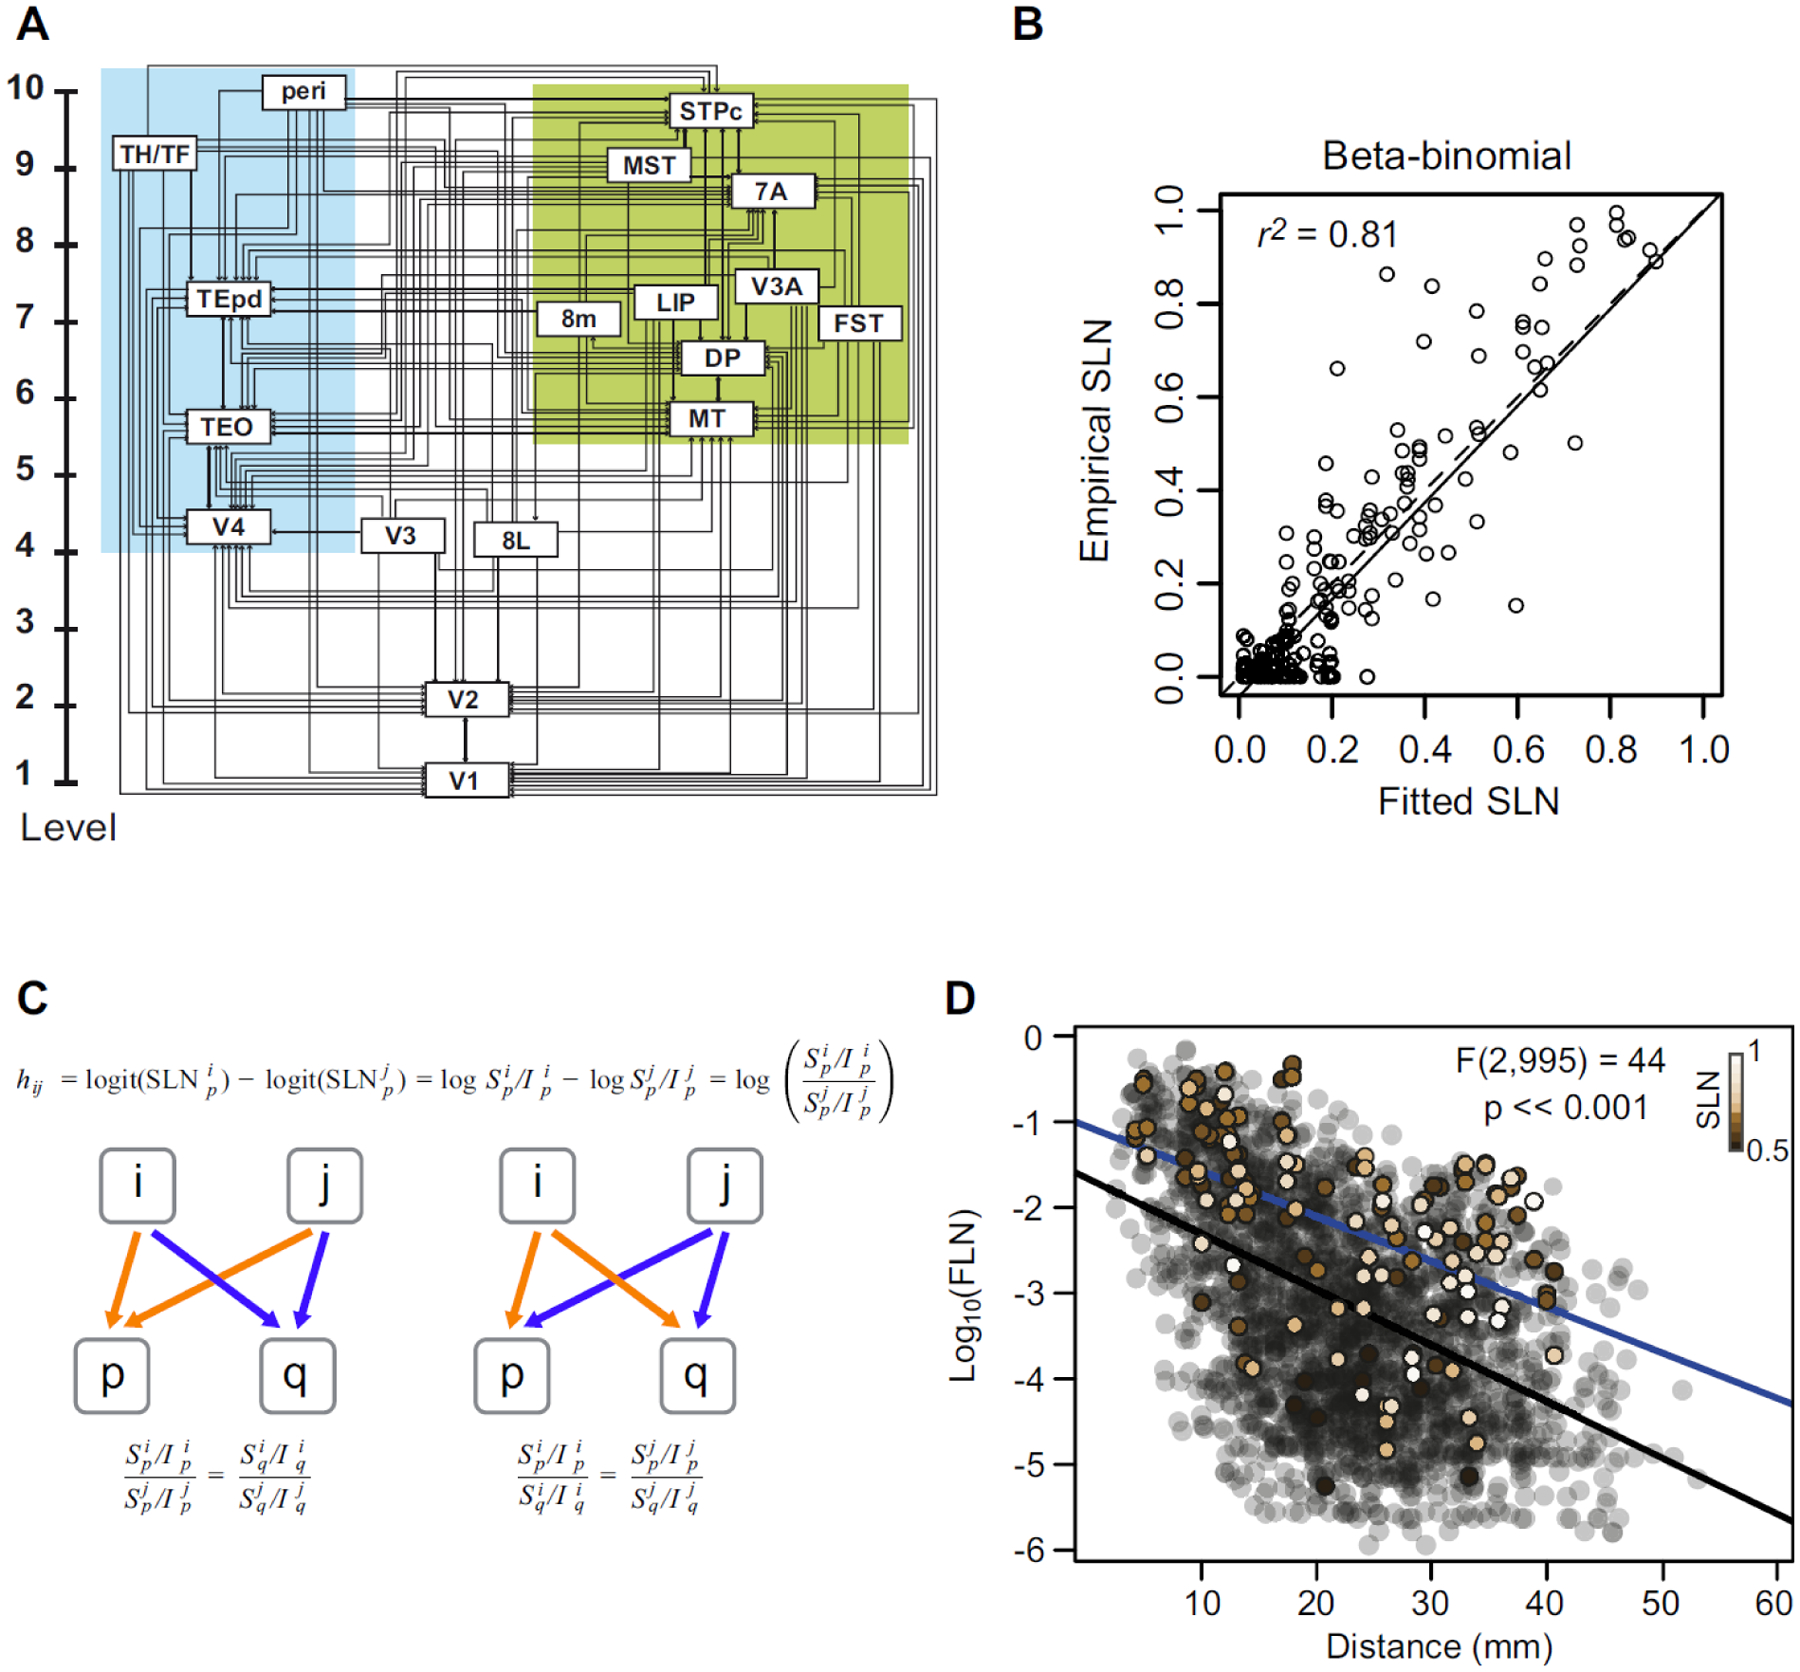
Figure 8. Hierarchical organization of visual areas (A) estimated from the beta-binomial model.

The model only provides the vertical level of the areas with respect to the lowest level. For clarity of presentation, we have separated them laterally into ventral and dorsal stream areas. The estimated values are only unique up to adding a constant and multiplying by a coefficient. Here, we have the areas to span the range 1–10. B) The scatter plot shows the empirical SLN values plotted against those predicted by the model. The solid line is the unit slope line through the origin and the dashed line is the best fit linear regression. C) Hierarchical distance. The hierarchical distance, hij, between common projections from areas i and j to area p, defined as the difference of logits of their SLN values, is equivalent to the log of the ratio of their supra- to infra-granular projection strengths to area p. a. This definition implies that the ratio between the laminar ratios of areas i and j to area p (orange arrows) is the same as that for any other target area q receiving projections from the same source areas (blue arrows), as formalized in the equation below the diagram. This is because the hierarchical distance from i to j should be the same for injections in both areas p and q. b. A rearrangement of the equation (below) implies, also, that the ratio between the laminar ratios of projections from a common source area, i, to areas p and q, will be the same for any other common source area, j, to the same target areas. D) Cortical-cortical strong loops. The strength-distance relation of 1615 projections from 91 to 29 cortical areas obtained from retrograde tracer injections. The transparent black points indicate all of the projections except those that participate in strong-loops in beige. The color gradient on these symbols corresponds to SLN strength as indicated by the inset color bar. The black line is the best fit linear regression to the transparent black points and the blue line is the best fit to the strong-loops. The F-statistic indicates the result of a nested likelihood test indicating the probability of a difference in strength between the two sets of points as large as that obtained under the null hypothesis that the true difference is zero, when physical distance via the WM is taken into account.
