
Figure 9.
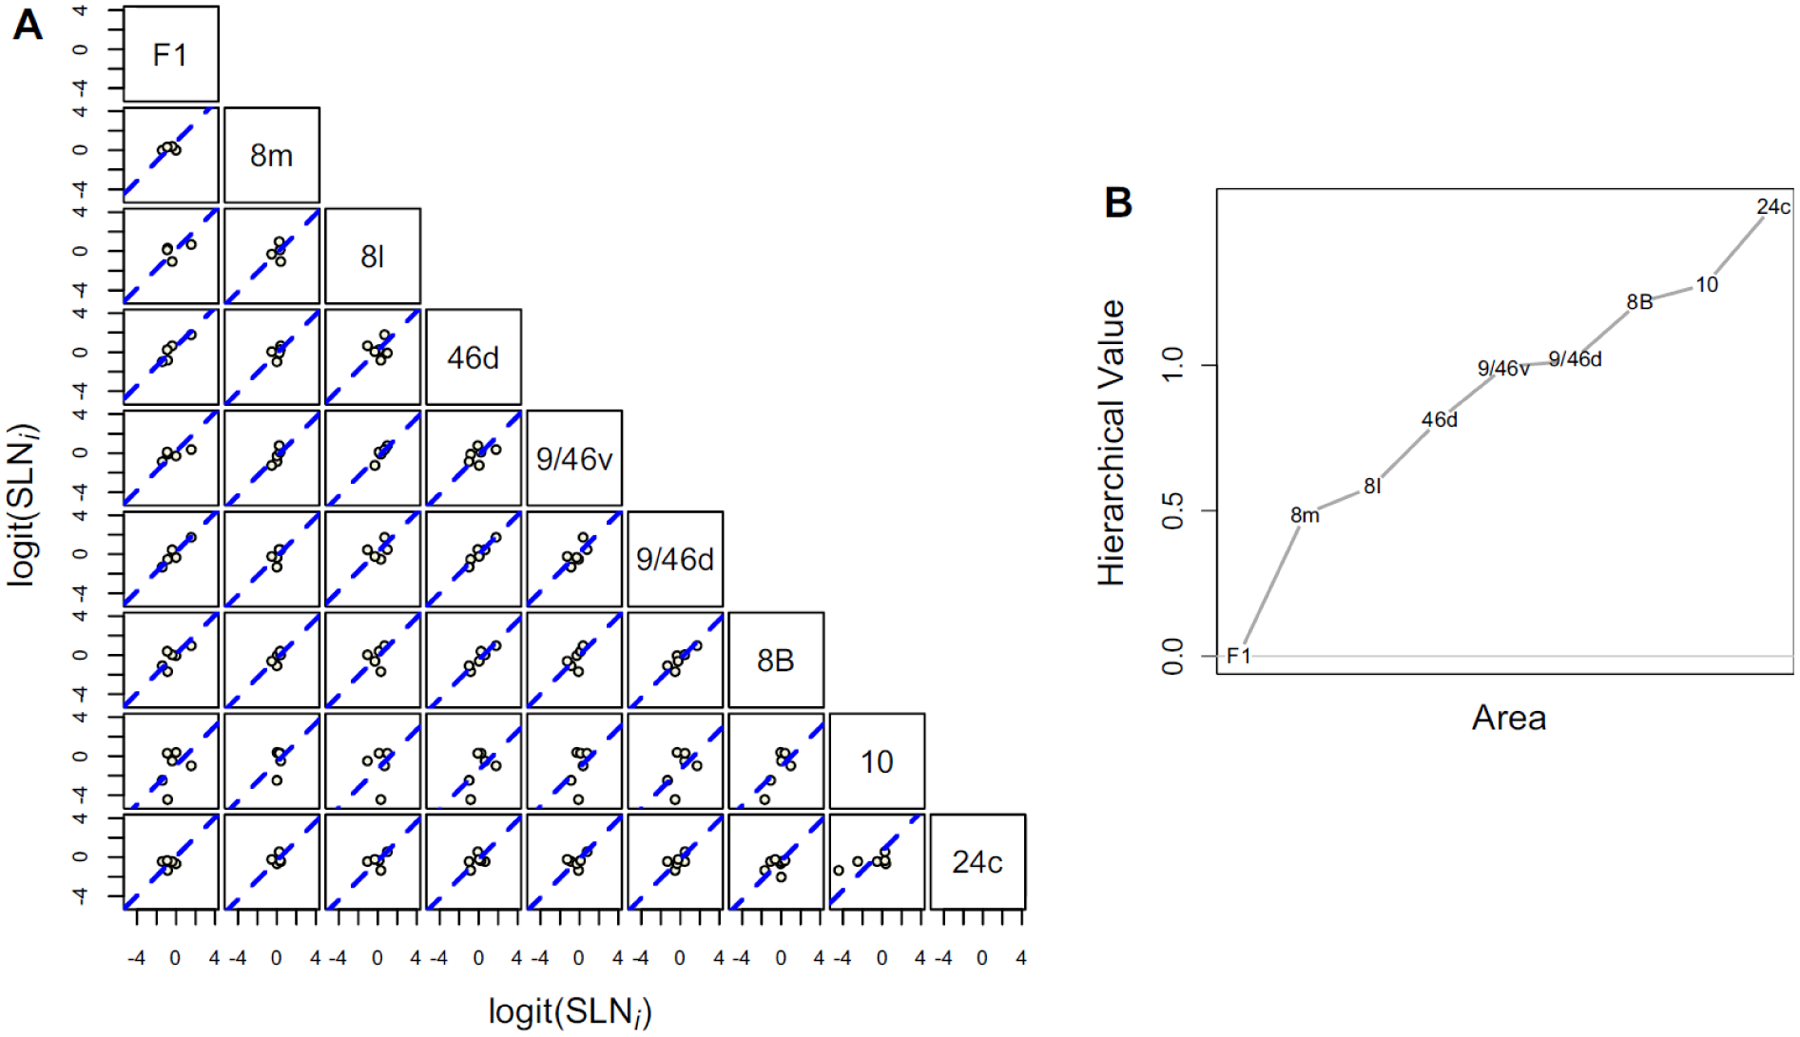
A) Scatter plots of logit transformed SLN values of common source areas from pairs of 9 frontal and pre-frontal areas, obtained from retrograde tracer injections. The plots follow the same format as previous in Figures 6 and 7. The dashed blue line in each plot is the best fit line of unit slope. B) Hierarchical scale values estimated for the 9 areas based on the proposed statistical model. Area F1 was assigned a value of 0 for model identifiability.