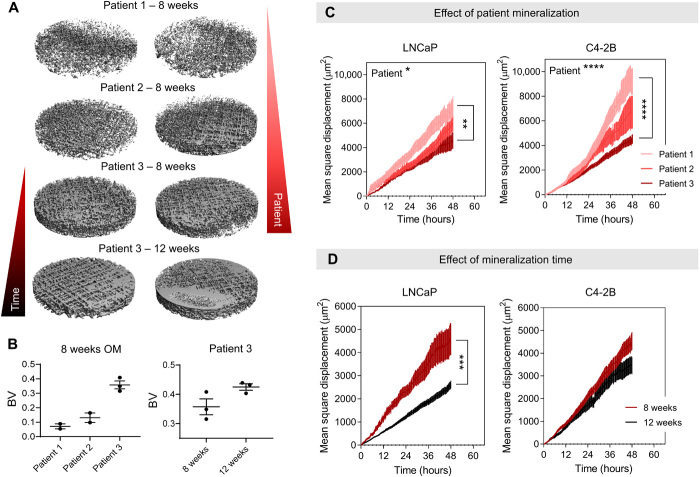
Fig. 3. Reduced mineralization increases cancer cell migration.
(A) Micro–computed tomography images of 5-mm biopsy punches hOBMT before coculture with cancer cells and (B) corresponding mineralization volumes (“BV”). Means ± SE, n = 3. (C and D) Mean square displacement of LNCaP and C4-2B on hOBMT over 48 hours under 10 nM DHT, according to (C) patients with increasing mineralization capacity (1 < 2 < 3) shown for 8 weeks culture in osteogenic media and (D) culture times in osteogenic media shown for patient 3 (8 weeks versus 12 weeks). Over two microtissues per condition analyzed with >8 random fields of view, for average n = 404 tracks. Means ± SE. *P < 0.05, **P < 0.01, ***P < 0.001, and ****P < 0.0001.

