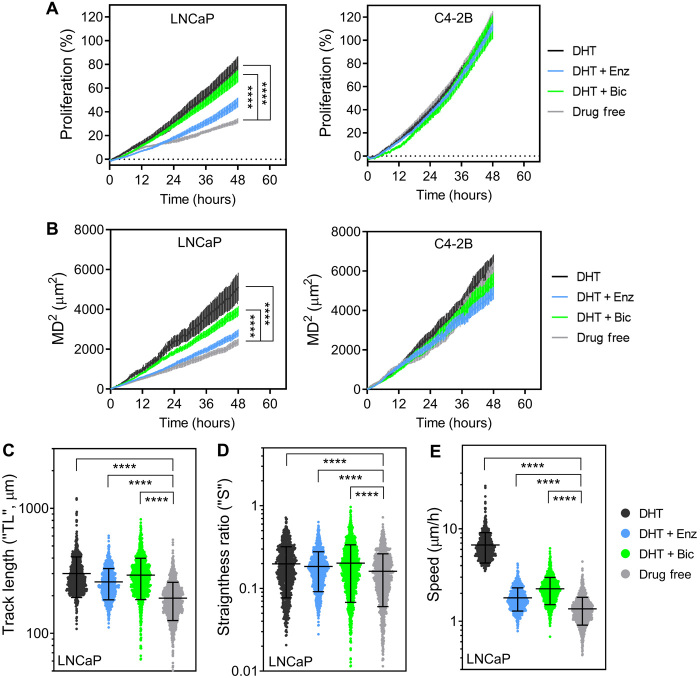
Fig. 5. Antiandrogen treatments affect the proliferation and migration of LNCaP but not C4-2B cells in the bone microenvironment.
(A) Cancer cell proliferation and (B to E) migration properties of cancer cells on hOBMT over 48 hours under various drug treatments; (B) mean square displacement, (C) track length, (D) straightness ratio, and (E) average cell speed. Over two biologically independent microtissues per condition analyzed with >8 random fields of view, for average n = 649 tracks. Means ± SE shown for (C) to (D) and scatter plots with means ± SE shown for (E) to (G). DHT, 10 nM; Enz (enzalutamide), 10 μM; Bic (bicalutamide), 10 μM. ****P < 0.0001.

